Figure 3.
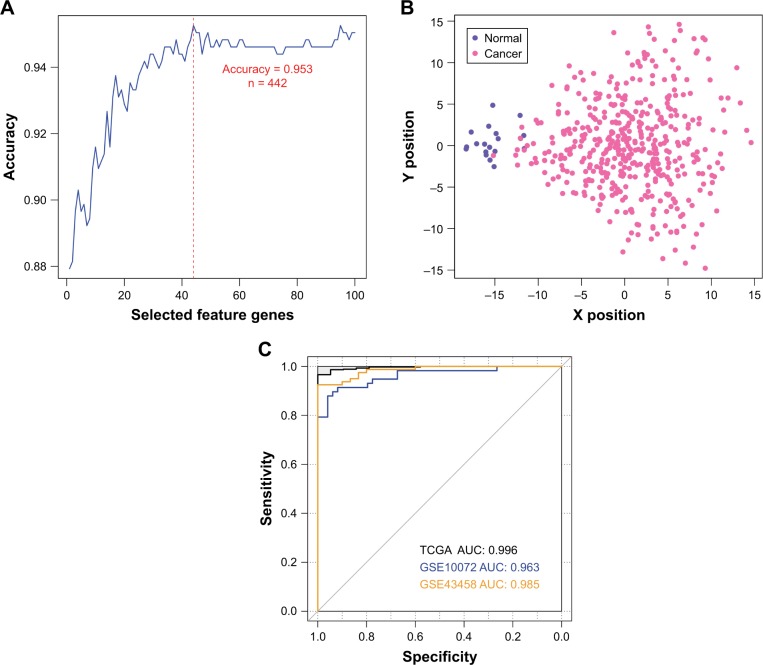
Construction and validation of the LUAD specific SVM classifier. (A) Feature gene selection based on recursive feature elimination. The prediction accuracy versus the number of selected feature genes is plotted as blue line. The red dashed line labels the best prediction accuracy (95.3%, 442 out of 464 TCGA samples), with the corresponding number of selected feature genes being 44. (B) Scatter plot of TCGA samples based on the LUAD specific SVM classifier. (C) ROC curves of TCGA (black), GSE10072 (blue) and GSE43458 (orange) datasets generated using the LUAD specific SVM classifier. AUCs are calculated to be 0.996, 0.963 and 0.985 for each data.
Abbreviations: LUAD, lung adenocarcinoma; SVM, support vector machine; TCGA, The Cancer Genome Atlas; ROC, receiver operating characteristic; AUC, area under ROC curve.

