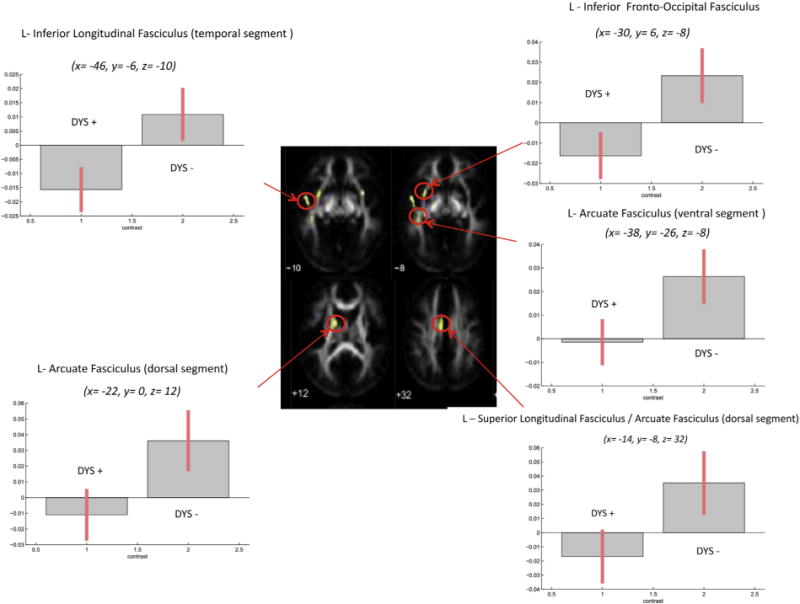
Fig. 4.

Fibre tracts exhibiting significant positive correlations of FA and average reading in DYS − versus DYS +. Plots of parameter estimates are represented for each tract for the two groups. Bars indicate correlation coefficients, which are measures of the strength of the relationship of FA and average reading.
