
Figure 5. Standard Object Discrimination Performance by Age Group.
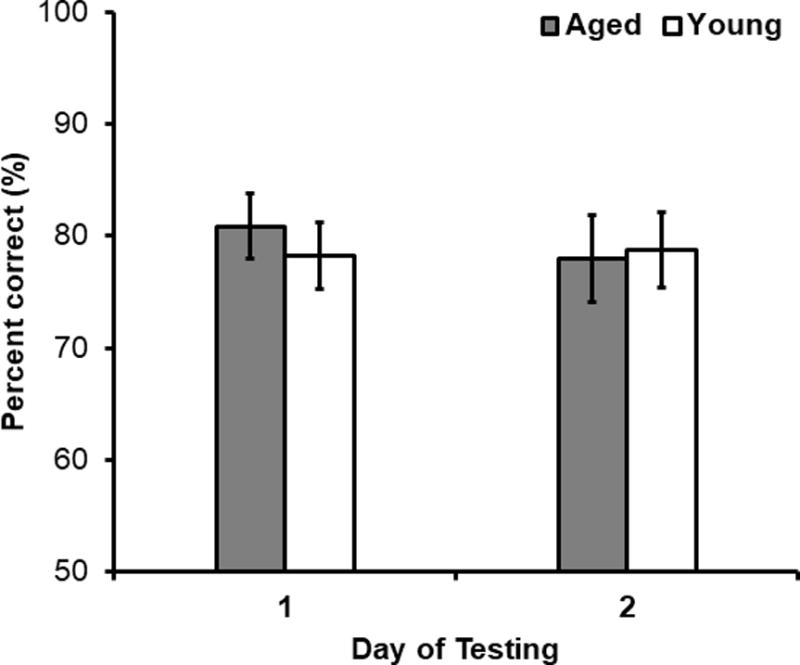
Standard object discrimination percent correct (%) as a function of test day in young (white) and aged (grey) rats. Performance did not significantly differ between test day (F[1,41] = 0.16, p = 0.69), or age group (F[1,41] = 0.07, p = 0.79). Moreover, the interaction effect between testing day and rat age was not significant (F[1,41] = 0.36, p = 0.55).