
Figure 5. CGRPα-EGFP (GENSAT) cochlea shows a basal-to-apical gradient labeling of SGNs.
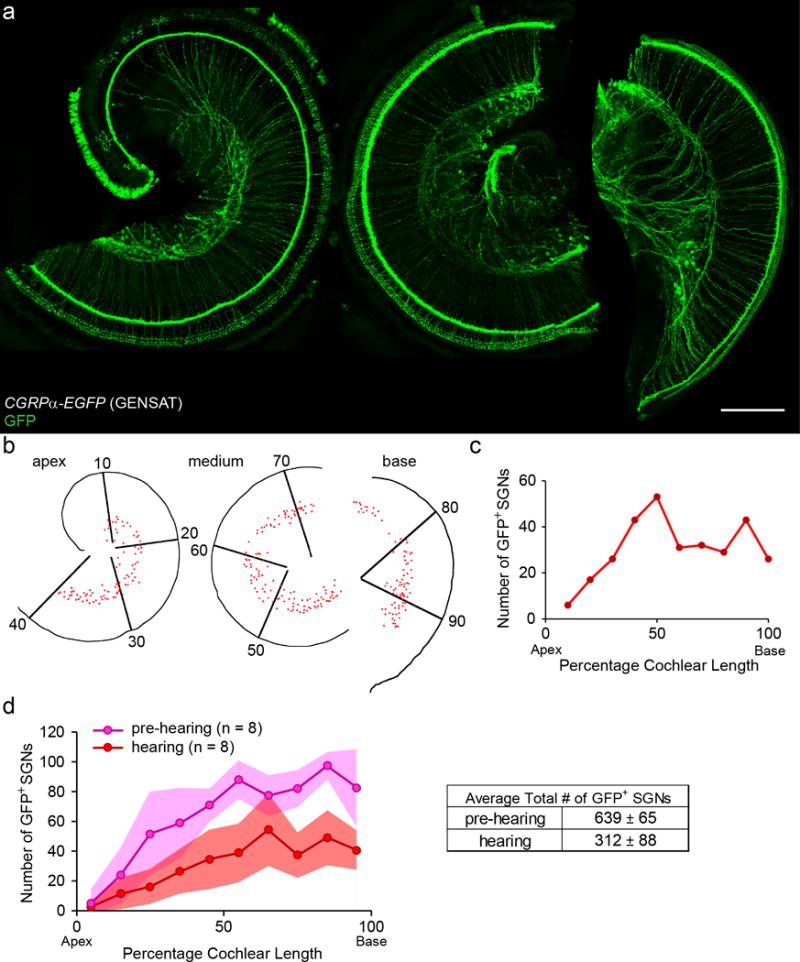
A representative cochlear whole mount of a one-month-old CGRPα-EGFP (GENSAT) mouse (a). Scale bar: 200 μm. The cochlear spiral shown in a is reconstructed in b with each red dot representing a GFP+ SGN. The SGN region is divided into 10 bins of equal length of cochlear spiral. The plot of the number of GFP+ SGNs identified in each bin for this example is shown in c. Quantification of the number of GFP+ SGNs before (P6-8, n = 8) and after hearing onset (~P30, n = 8) in CGRPα-EGFP (GENSAT) cochleas (d). Shaded areas represent standard deviations.