
Figure 5.
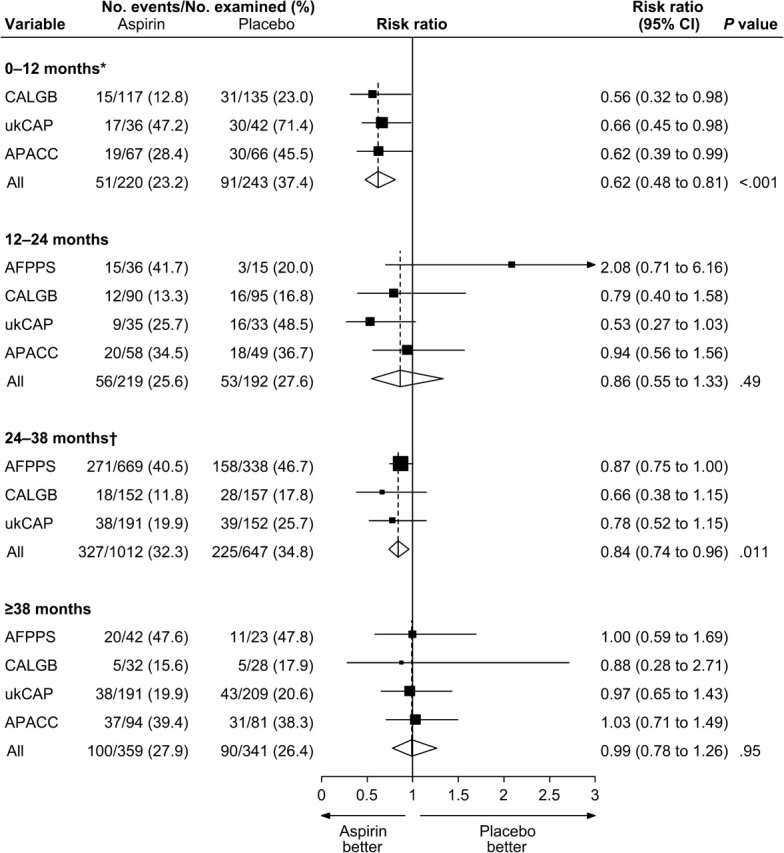
Random-effects risk ratio forest plot comparing any aspirin vs placebo in terms of adenoma risk by time interval after randomization. Trial-specific risk ratios are shown as black squares , with the size of the square being inversely proportional to the trial-specific risk ratio variance. Horizontal lines represent 95% confidence intervals for the trial-specific risk ratios. Pooled risk ratios are shown as diamonds . The middle of each diamond corresponds to the risk ratio, and the width of each diamond represents the 95% confidence interval. The vertical dashed lines provide a visual comparison of the pooled risk ratios with the corresponding trial-specific risk ratios. *The AFPPS trial had no examinations during the 0- to 12-month interval. †The APACC trial had only two examinations during the 24- to 38-month interval. AFPPS = Aspirin/Folate Polyp Prevention Study; CALGB = Cancer and Leukemia Group B; APACC = Association pour la Prevention par l’Aspirine du Cancer Colorectal; CI = confidence interval; ukCAP = United Kingdom Colorectal Adenoma Prevention.