
Fig. 1.
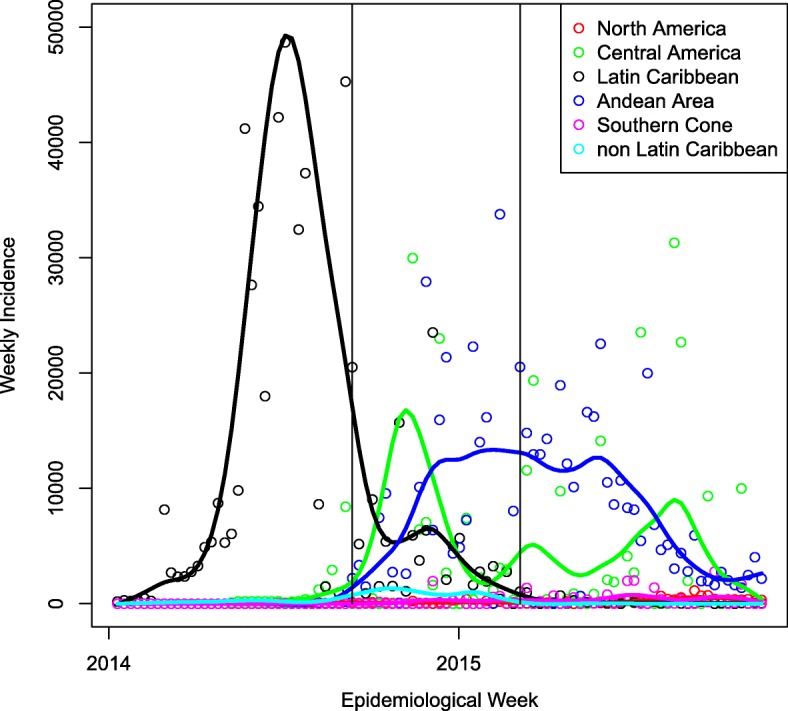
Weekly incidence of chikungunya cases, aggregated by region from PAHO reports (symbols) and smoothed epidemic curves (lines). The two vertical lines show the beginning and end of the prediction period for the DARPA Challenge
Official websites use .gov
A
.gov website belongs to an official
government organization in the United States.
Secure .gov websites use HTTPS
A lock (
) or https:// means you've safely
connected to the .gov website. Share sensitive
information only on official, secure websites.
Weekly incidence of chikungunya cases, aggregated by region from PAHO reports (symbols) and smoothed epidemic curves (lines). The two vertical lines show the beginning and end of the prediction period for the DARPA Challenge