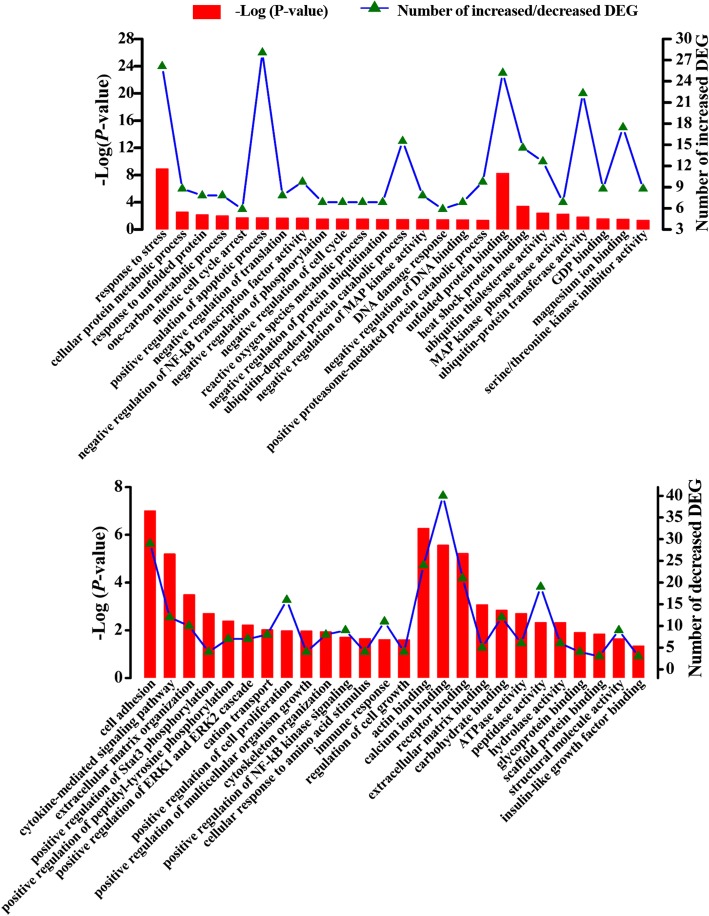
Fig. 4.
Functional characterization of the increased or decreased transcripts in the mammary gland of cows fed alfalfa hay (AH) vs. corn stover (CS) by gene ontology analysis. DEG indicates differentially expressed genes. The x-axis shows the functional categories of the increased or decreased genes, the left y-axis shows the value of –Log (p-value) and the right y-axis shows the number of increased/decreased genes

