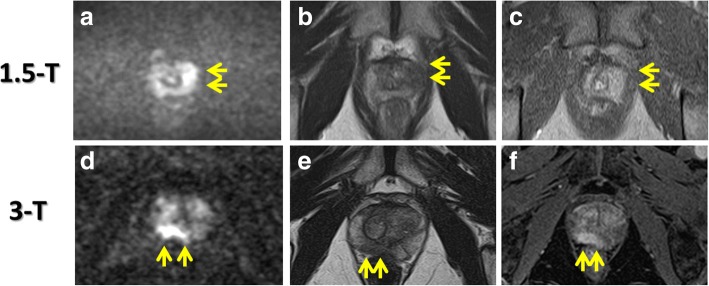
Fig. 2.
MRI images. 1.5-Tesla MRI images obtained from a patient with a PSA level of 3.86 ng/mL (A − C). Diffusion weighted image (DWI) with a b-value 1500 s/mm2 (A) showed a high intensity area in the left peripheral zone (Arrow). T2 weighted image (T2WI: B) and dynamic contrast enhancement image (DCEI: C) showed a low intensity area and an enhancement, respectively, in the same lesion, which was considered to be a high level of suspicious. 3-Tesla MRI images obtained from a patient with a PSA level of 3.57 ng/mL (D − F). DWI with a b-value 2000 s/mm2 (D) showed a high intensity area in the right peripheral zone (Arrow). T2WI (E) and dynamic DCEI (F) showed a low intensity area and an enhancement, respectively, in the same lesion, which was considered to be a high level of suspicious

