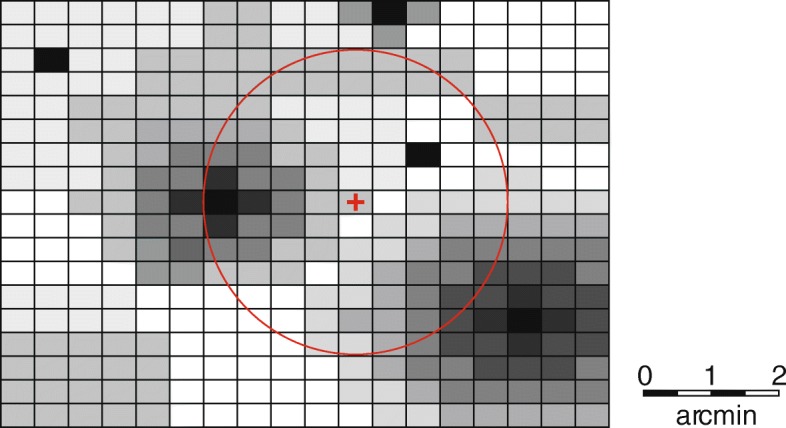
Fig. 4.

Grid section for a single taxon including area and point occurrences with different extents and uncertainties, respectively. The circle shows the sampling radius around the test position (red cross) being queried. The opacity of a tile is proportional to the taxon’s likelihood of being encountered there
