
Figure 10.
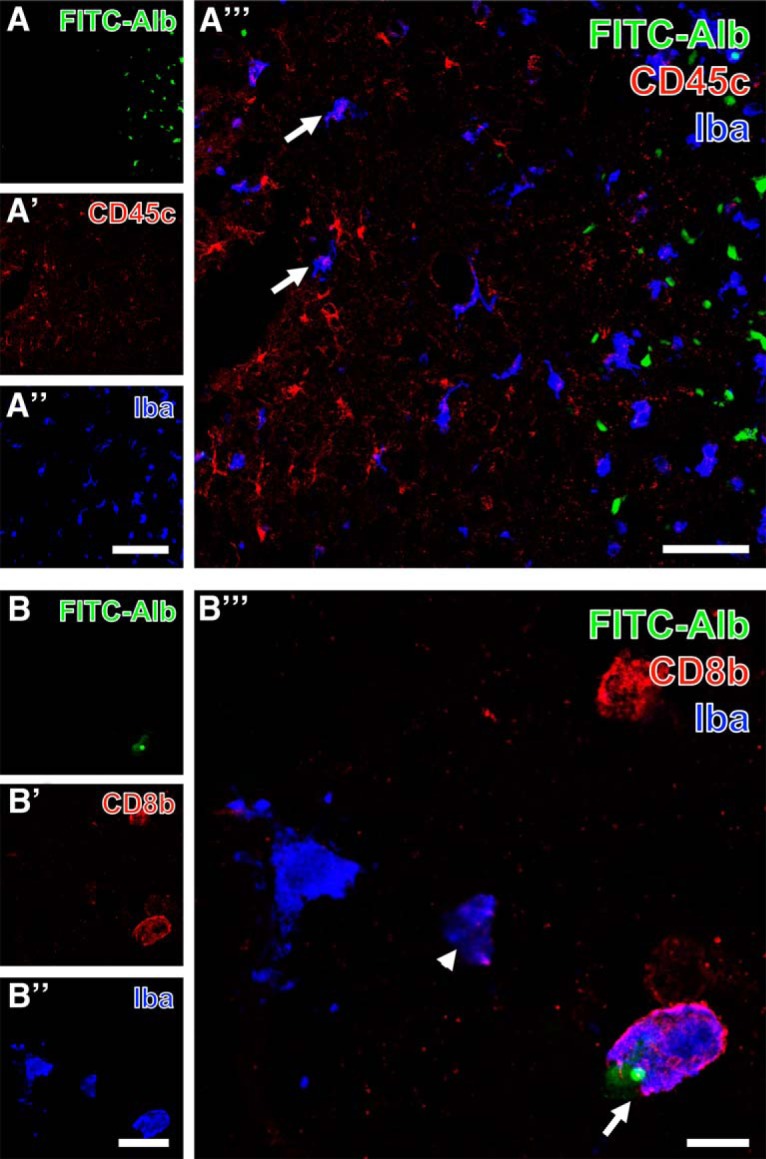
Triple fluorescence labeling of FITC-coupled albumin (FITC-Alb) and Iba combined with the immunodetection of immune cells expressing either CD45c (A–A″′) or CD8b (B–B″′) in thalamic regions 48 h after SE. FITC-Alb–filled cells are here restricted to a clearly delineated zone (A), whereas CD45c-immunodetection (A′) visualizing the leukocyte common antigen is stronger in tissue devoid visible FITC-Alb and Iba (A″), which is seen in more evenly distributed ameboid immune cells. The overlay of staining patterns (A″′) clearly shows several cells coexpressing both microglial markers (exemplified by arrows in A″′), whereas all FITC-Alb–stained cells appear monolabeled. At higher magnification, one cell displays not only a cytoplasmic label with FITC-Alb (B), but also a small, round compartment with a much stronger fluorescence signal. This cell and three other cells with similar ameboid appearance are additionally Cy3-labeled for CD8b indicating a subset of lymphocytes, whereas Cy5 immunostaining of Iba (B″, color-coded in blue) is also present in apparently CD8b-immunonegative cells. The overlay of staining patterns clearly demonstrates two cells coexpressing both immune cell markers either containing FITC-Alb (arrow) or being devoid of FITC-Alb (arrowhead). Scale bars: A″ (also valid for A, A′) = 100 µm, A″′ = 50 µm, A″ (also valid for B, A′) = 25 µm, B″′ = 10 µm.