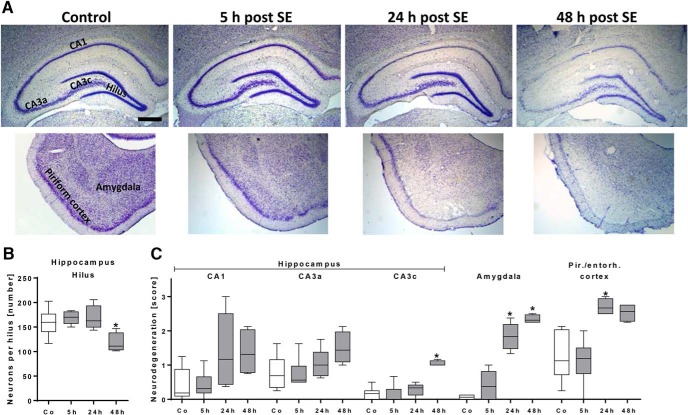
Figure 3.
Histologic evaluation of neurodegeneration during early epileptogenesis. A, Representative images of Nissl-stained forebrain sections (–3.6 mm relative to bregma; left hemisphere; hippocampus, piriform cortex/amygdala) of a control rat and rats 5, 24, and 48 h following status epilepticus (SE). Scale bar = 500 µm. B, Number of hilar neurons in control rats (n = 6) and rats 5 h (n = 6), 24 h (n = 5), and 48 h (n = 4) following SE, revealing neurodegeneration only at 48 h post-SE. C, Semiquantitative analysis of neurodegeneration in hippocampal subregions, amygdala, and cortical subregions in control rats (n = 6) and rats 5 h (n = 6), 24 h (n = 5), and 48 h (n = 4) following SE. * p < 0.05 compared to control, one-way ANOVA (B); Dunnett’s multiple comparison test, Kruskal–Wallis ANOVA, and Dunn’s multiple comparison test (C). Data are illustrated as box-and-whisker plots. CA, cornu ammonis. Co, control, Pir./entorh., piriform/entorhinal.

