
Figure 7.
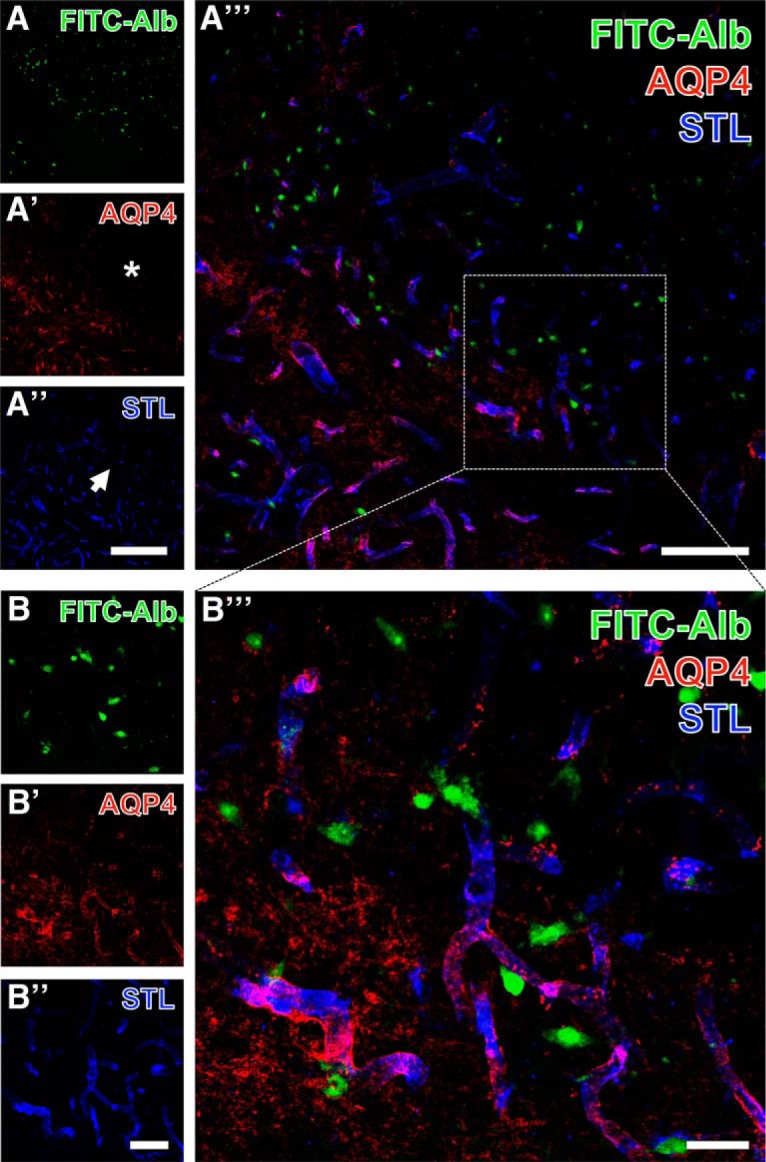
Concomitant visualization of thalamic FITC–coupled albumin (FITC-Alb) 24 h after SE with astroglial aquaporin-4 (AQP4, astrocytic endfeet) and endothelial Solanum tuberosum lectin (STL) binding as overview (A–A″′) and at higher magnification (B–B″′). FITC-Alb is seen in numerous neuron-like cell somata (A, B). AQP4 immunolabeling (A′, B′) is largely absent in FITC-Alb–positive tissue marked by asterisks in A′ but distinctly expressed in adjacent areas. STL staining in the same area appears diminished (A″, arrow). The overlay of staining patterns (A″′, B″′) elucidates allocated AQP4-immunoreactive astrocytic endfeet and endothelial STL-binding sites appearing as purple vessels in close vicinity to many FITC-Alb–filled cells. Scale bars: A″ (also valid for A, A′) = 200 µm, A″′ = 100 µm, B″ (also valid for B, B′) = 50 µm, B″′ = 25 µm.