
Figure 9.
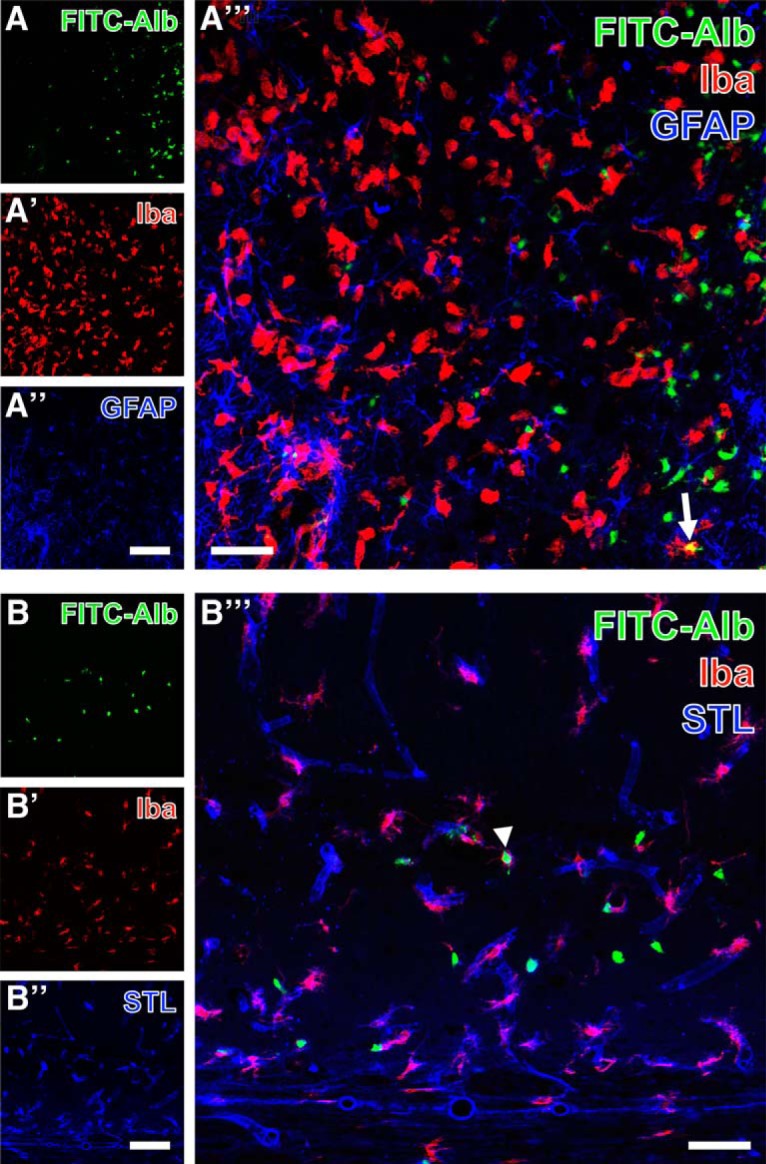
Demonstration of FITC-coupled albumin (FITC-Alb) and Iba-immunoreactive microglia/macrophages combined with thalamic GFAP immunolabeling 48 h after SE onset (A–A″′) and the detection of hippocampal Solanum tuberosum lectin (STL)-binding sites 24 h after SE onset (endothelial cells, B–B″′). FITC-Alb in the thalamus is predominantly visible within neuron-like cells (A). The same region contains Iba-immunopositive ameboid microglia that are even more strongly labeled in adjacent tissue with less FITC-Alb (A′). In parallel, proliferating astrocytes are revealed by GFAP immunostaining (A″). The merge of staining patterns (A″′) allows for the identification of single FITC-Alb–filled immune cells displaying the mixed color yellow (arrow in A″′). Additionally, hippocampal FITC-Alb–positive cells are allocated with Cy5 staining of STL-binding sites and Cy3-immunolabeling of Iba (arrowhead, B″′). Scale bars: A″, A″ (also valid for A, A′, B, B′) = 100 µm, A″′, B″′ = 50 µm.