. 2015 Nov 11;7(2):1322–1337. doi: 10.1039/c5sc03207e

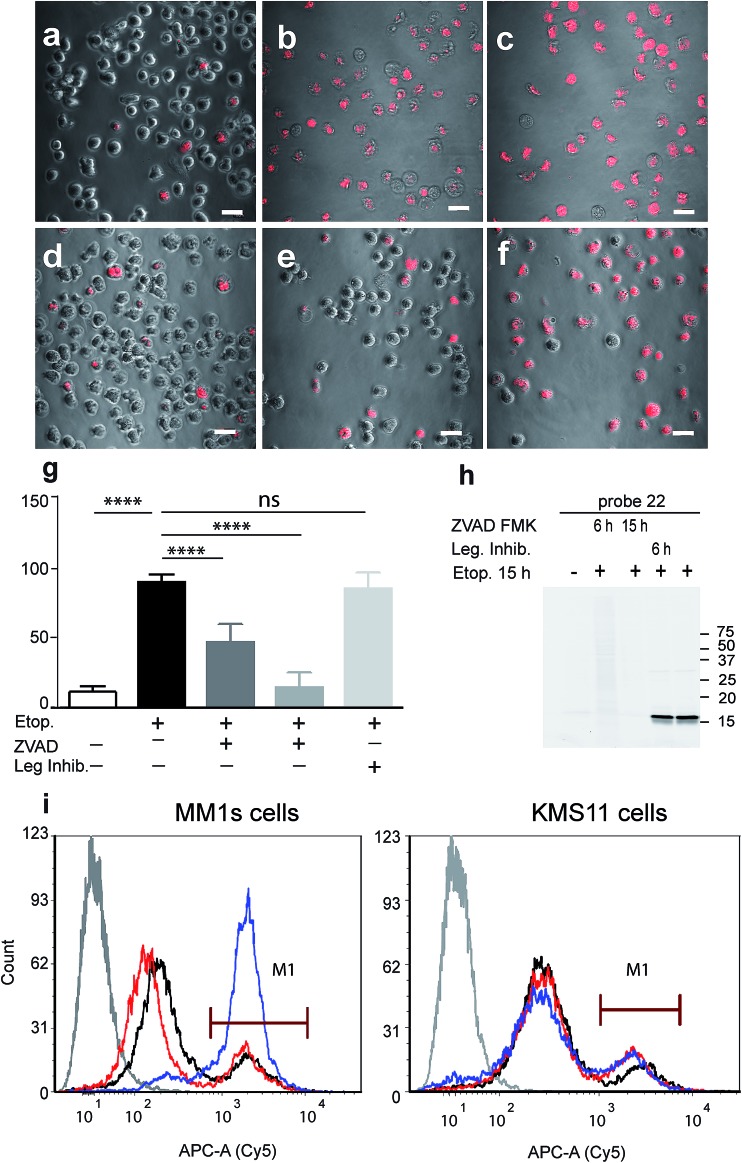
Fig. 3. Fluorescent analysis of apoptotic MM1s cells using probe 22. MM1s cells were treated with etoposide for 15 hours, during the last 3 hours probe 22 was added. Cells were pretreated with the caspase inhibitor or legumain inhibitor for indicated times. (a) Control vehicle treated cells, (b) and (c) etoposide treated cells, (d) ZVAD-FMK added with etoposide, (e) ZVAD-FMK added 9 hours after etoposide, (f) legumain inhibitor added 9 hours after etoposide. Cy5 fluorescence (red) overlaid on bright field images were taken of living cells with an Olympus confocal microscope, scale bar = 10 μm. (g) Quantification of labeled cells, the percent of Cy5 labeled cells was quantified by counting the red cells, at least 10 fields were taken of each treatment. (h) Fluorescent gel analysis of samples presented in (a)–(f), fluorescent bands are active caspase-3. (i) FACS analysis of apoptotic MM1s cells (left) and KMS11 cells (right) labeled by 22. Cells were treated with etoposide for 18 hours, during the last three hours 22 was added for labeling of active caspase-3. Non-treated cells, black line, cells with etoposide and ZVAD-FMK, red line, cells with etoposide, blue line and cells without probe or etoposide, gray line. ANOVA test using Sidak's correction for multiple comparisons was applied, **** denotes adjusted p value < 0.001.

Fig. 3