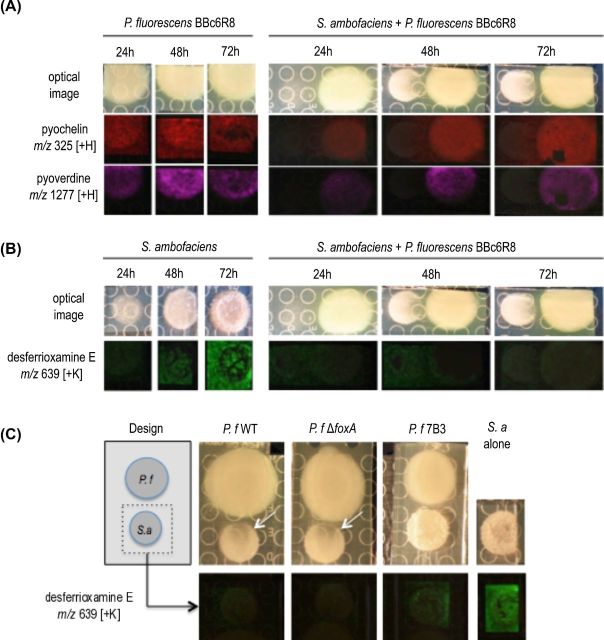
Figure 4.
Microbial IMS images of secondary metabolites produced by P. fluorescens BBc6R8 (A) and S. ambofaciens ATCC23857 (B) when cultured alone or side by side on KB medium. Optical images are displayed in the top row, all other images are overlays of falsely colored m/z distributions over optical images. (C) Production of desferrioxamine E by S. ambofaciens ATCC23857 when cultured alone or side by side with P. fluorescens BBc6R8 WT or mutants Tn5::foxA or 7B3. The white arrows on the optical images point at the inhibition zone on the colony of S. ambofaciens.

