. 2015 Nov 10;7(2):1298–1308. doi: 10.1039/c5sc03223g

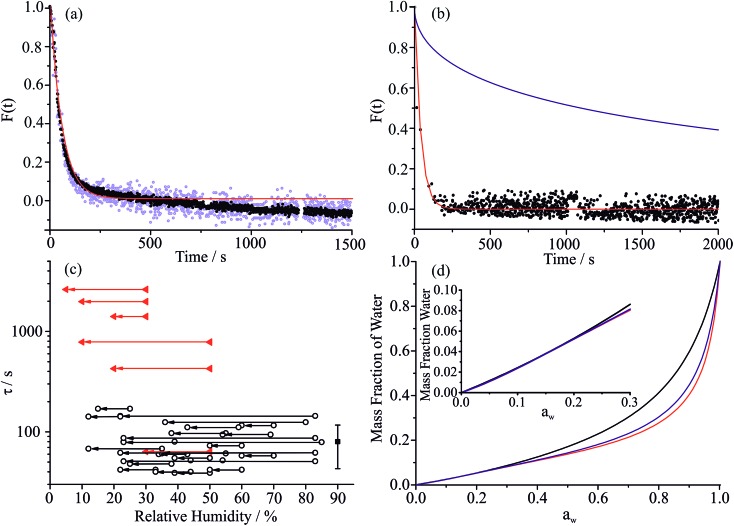
Fig. 2. (a) Response functions for radius (black) and RI (purple) for a RH change between 69% and 54%, consistent with a β value of 1 (fit, red line). (b) Comparison of the fitted response functions for relaxation in radius for a MA/sucrose droplet (measurements, black circles; fit, red line) and an aqueous sucrose droplet (blue, fit line) experiencing the same RH change (33–23%). (c) Fitted values for the time constant, τ, for various RH step changes for MA/sucrose droplets (black circles) and aqueous sucrose droplets (red triangles). The direction of the arrow represents the RH change with the points indicating the initial and final RH between which the RH is changing. The average and standard deviation of the relaxation times for all RH transitions from all MA/sucrose droplets studied is shown arbitrarily at 90% for comparison. (d) Variation in mass fraction of water with water activity for aqueous MA (black), aqueous sucrose (red) and a 5 : 1 sucrose/MA mixture (blue) calculated from the adsorption isotherm model with the inset showing the behaviour at low water activity.

Fig. 2