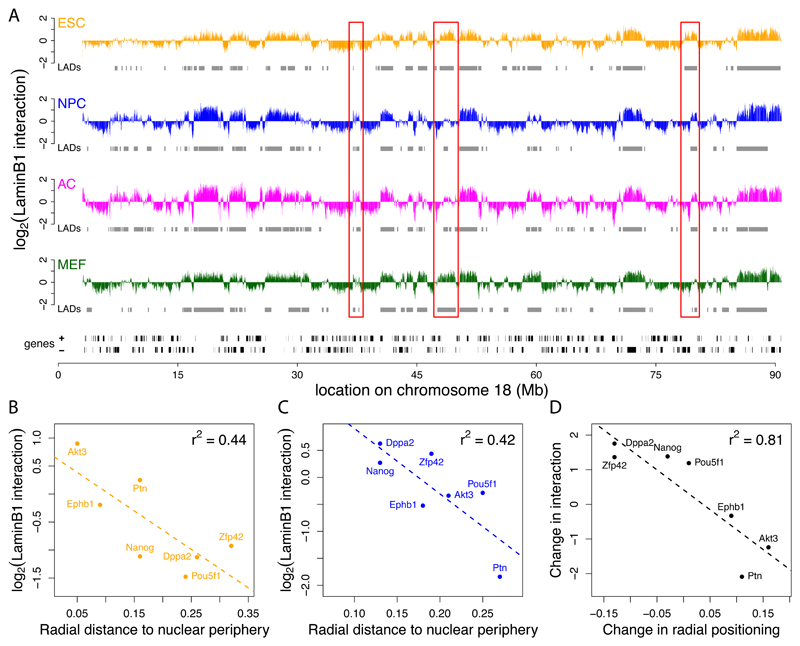
Figure 1. Chromosomal maps of NL interactions.
(A) LaminB1 binding profiles for ESCs (orange), NPCs (blue), ACs (magenta), and MEFs (green) along mouse chromosome 18. Y-axis depicts the log2 transformed Dam-LmnB1 over Dam methylation ratio. Grey rectangles below each track represent LADs for each cell type, black rectangles at the bottom represent genes. Red boxes mark some regions of reorganization during differentiation. (B-D) FISH microscopy data validates NL interaction maps. Scatter plots showing correlation between the mean LaminB1 binding score per gene and the radial distance to the nuclear periphery as determined by FISH (Hiratani et al., 2008) in ESCs (B) and NPCs (C) for 7 loci. (D) Concordance between changes in NL interactions and changes in radial position upon ESC to NPC differentiation (p = 0.005621).

