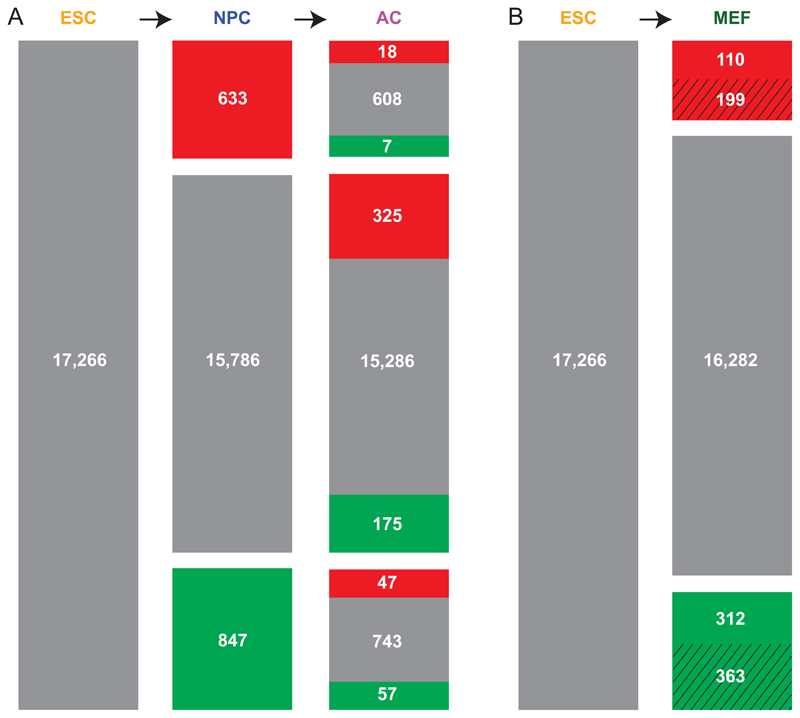
Figure 4. Cumulative reorganization of NL-gene interactions in subsequent differentiation steps.
Out of a curated set of 17,266 genes, the numbers of genes are indicated that exhibit statistically significant increased (red) or decreased (green) levels of NL interactions compared to the preceding differentiation state. (A) ESC→NPC→AC lineage; (B) ESC→MEF lineage, which is a virtual lineage because the MEFs were not directly derived from the ESC culture. Striped areas represent genes that are also modified in one or both steps of the ESC→NPC→AC lineage.

