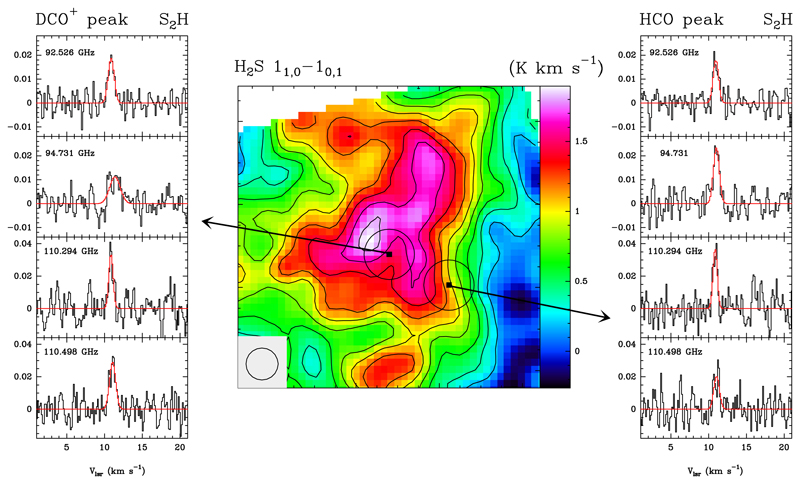
Figure 1.
In the central panel, we show the integrated intensity map of the H2S 11,0→10,1 line (168.763 GHz). UV-illumination from σOri comes from the west (right). The beam is drawn in the bottom-left corner. Black circles around the surveyed positions indicate the beam of the S2H detections. Spectra of the four S2H lines detected towards the two positions targetted in the Whisper spectral are plotted in the left (DCO+ peak) and right (HCO peak) panels. The frequency in GHz is indicated in the top-left corner. In red, the Gaussian fits shown in Table 1.

