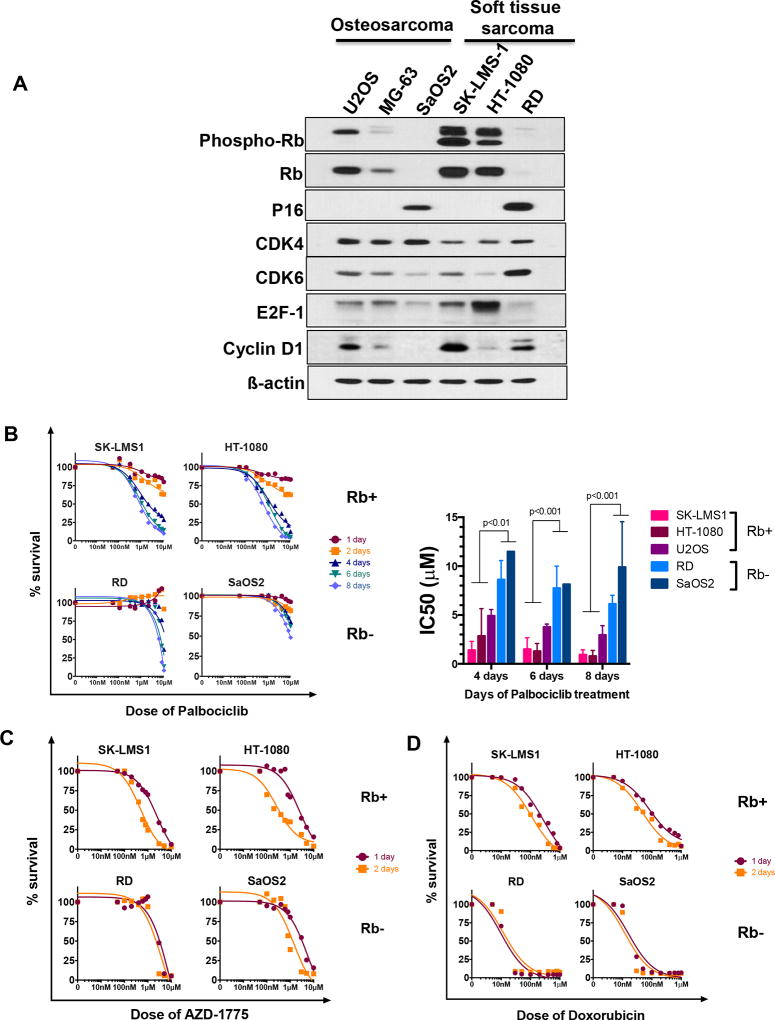
Figure 1. G1 checkpoint characterization and sensitivity to drug treatments.
(A) Western blots for indicated proteins, using actin as a loading control. These blots show that SK-LMS1 and HT-1080 are Rb-positive, and therefore represent ideal models for evaluating CDK4/6 inhibitor-based therapy. (B) Sensitivity of sarcoma cell lines to palbociclib treatment for 1–8 days as indicated, measured by MTT on day 13. Graph shows IC50 for each cell line as a function of length of treatment (n=2–4 experiments). (C) Sensitivity of sarcoma cell lines to treatment with Wee1 kinase inhibitor (AZD1775) for 1 or 2 days (n=2 experiments). MTT was performed on day 12/13 to measure survival proportion. (D) Sensitivity of 4 sarcoma cell lines to 1 or 2 days of treatment with doxorubicin (n=2 experiments). MTT was performed on day 12/13 to measure survival proportion.

