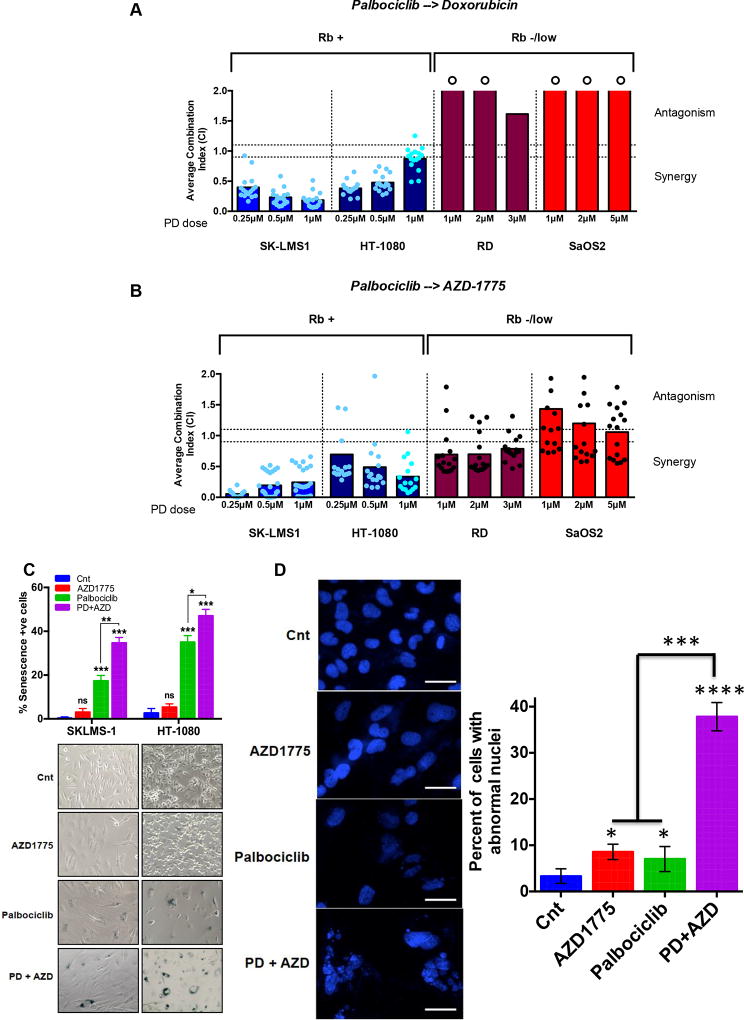
Figure 4. Combination treatment with palbociclib followed by doxorubicin or Wee1 inhibitor is synergistic in Rb-positive sarcoma cell lines.
(A) Average combination index (CI) for sequential treatment with palbociclib for 6 days, followed by recovery for 9 hrs (except HT-1080 which was 6 hrs) and doxorubicin or (B) AZD1775 for 2 days. Survival was quantified using MTT on day 12 and survival fraction data were input into CalcuSyn software to generate the CI. Each dot represents one of the pairs of drug concentrations. Dotted lines represent the CI range of additivity (0.9–1.1), antagonism (>1.1) or synergism (<0.9). A circle above a bar means that the CI exceeds 2 but was capped at 2 for data presentation. (C) SA-β galactosidase activity measurement (top) with representative images (bottom) of SKLMS-1 and HT1080 cells treated with palbociclib (6 days) followed by 9 hrs (SKLMS) or 6 hrs (HT1080) recovery followed by AZD1775 (2 days). (D) Representative images of DAPI staining (left) and quantitation (right) of SK-LMS1 cells treated with palbociclib for 9 days, then allowed to recover for 9 hrs followed by 48 hrs of AZD treatment. Single drug treatments were performed in parallel either in the absence of palbociclib or AZD. At the end of treatment, cells were fixed with methanol and stained with DAPI to visualize nuclear morphology. Scale bars equal 50 µ. A minimum of 150 cells (per condition) were scored for abnormal nuclear morphology. All data represent mean±SD from three independent experiments; p-values were calculated in comparison with control treated cells unless indicated otherwise, ns: p>0.05; *p<0.05; **p<0.01; ***p<0.001; ****p<0.0001

