
Figure 1. Hdc Expression Identifies MB-HSC.
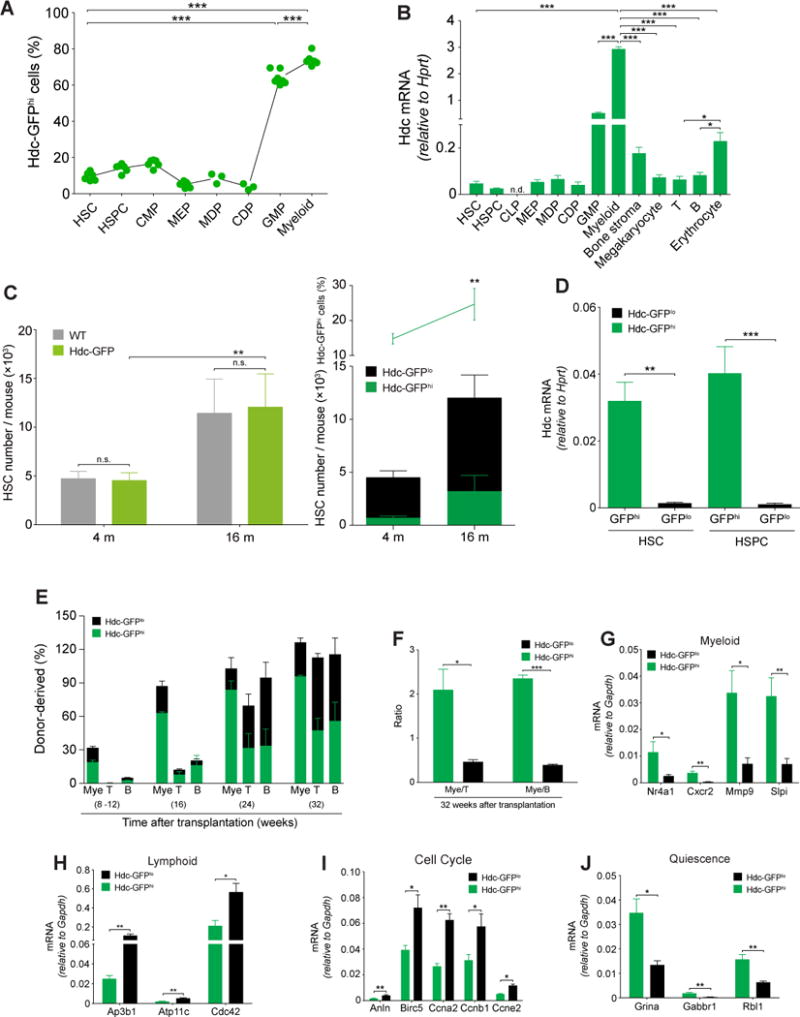
(A) Percentage of Hdc-GFPhi cells in lineages of bone marrow (BM) cells (n = 3 - 7 per group). Six independent experiments. (B) mRNA expression of Hdc gene in BM cells and stromal cells (n = 3 - 5). (C) Quantification of Hdc-GFPhi HSCs in Hdc-GFP and WT mice (n = 3 per group). (D) Hdc mRNA expression in Hdc-GFPhi and Hdc-GFPlo BM HSCs and HSPCs (n = 3 per group). (E) Contribution of Hdc-GFPhi HSCs (n = 12) to lethally irradiated recipients. (F) Blood myeloid/lymphoid ratio of recipients in (E). (G-J) Relative mRNA expression of myeloid (G) and lymphoid lineage (H), cell cycle (I), and quiescence signatures genes (J) in HSCs (n = 3 - 4 per group). Data were analyzed with one-way analysis of variation (ANOVA) with Bonferroni post-hoc test (A and B) or two-tailed Student’s t-test (C-J). See also Figure S1-S3.