
Figure 1.
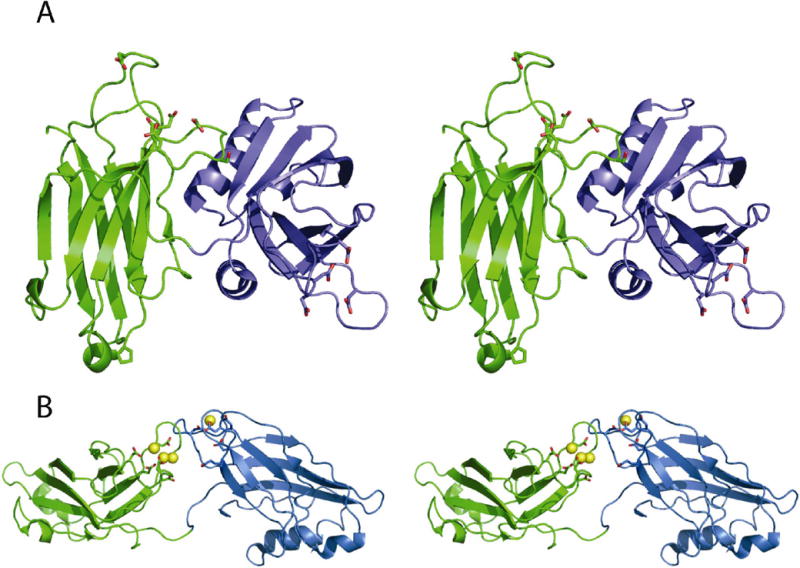
The open and closed conformations of synaptotagmin. (A) Stereoview of Syt1 C2A-C2B in the closed configuration. The C2A domain is colored as green ribbons. The C2B domain is colored as blue ribbons. The six known Ca+2-binding residues are shown as sticks. (B) Stereo diagram of synaptotagmin 3 C2A-C2B in the open configuration (pdb code: 1DQV). The C2A domain in Syt3 is rendered as green ribbons. The C2B domain in Syt3 is rendered as blue ribbons. Yellow spheres represent magnesium ions.