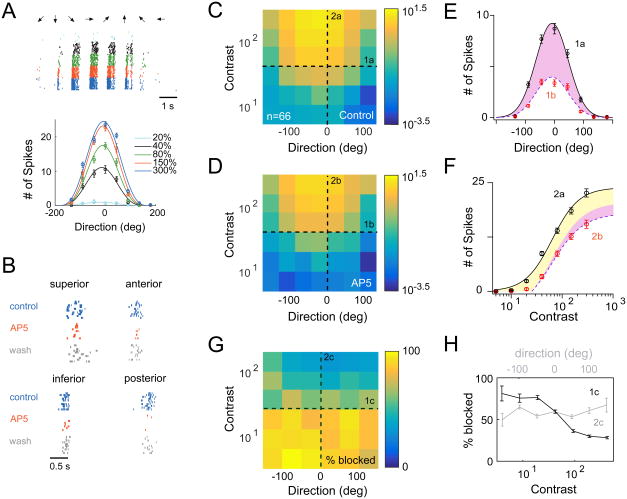
Figure 6. Additive and multiplicative scaling operations mediated by NMDA receptors.
A. An example DSGC response recorded on a multi-electrode array. Spikes were evoked by drifting bars (240 μm wide on the retina, moving at 960 μm/s; 8 directions, 7 contrasts indicated by different colors; 10 trials for each contrast). ON-OFF DSGCs were distinguished from other ganglion cells based on their tuning properties: see Figure S5). The bottom plot shows the tuning curves of this DSGC plotted for multiple contrasts (mean ± SEM). Responses at each contrast were fit with a cosine function.
B. NMDA receptor antagonist, 50 μM D-AP5, reversibly reduced responses (preferred motion; 20-40% contrast) to a similar extent in the four subtypes of ON-OFF DSGCs.
C. A heat map of the population DSGC response as a function of direction and contrast measured in control conditions (the color bar indicates the average number of spikes/trial on a logarithmic scale). Responses were averaged across the four types of ON-OFF DSGCs (21 superior, 12 inferior, 27 anterior, and 6 posterior-coding DSGCs).
D. Same as C, except responses were measured in the presence of D-AP5.
E. Cross-sections of the heat maps along the direction axis, in control and in D-AP5 (1a from C; 1b from D). The solid line indicates the Gaussian fit of the control data (black circles). The same Gaussian fit could be scaled to approximate the response measured in D-AP5 (red circles; purple shaded region indicates the D-AP5-sensitive component that could be accounted for by multiplicative scaling; See Figure S6). Data are represented as mean ± SEM.
F. Cross-sections of the heat maps along the contrast axis, in control and in D-AP5 (2a from C; 2b from D) for preferred direction stimuli. The control response (black circles) was fit with the hyperbolic Naka-Rushton Equation (solid line; see methods). The response measured in D-AP5 (red circles) could be approximated by scaling the control response in the Y-dimension as depicted by the dashed line (purple and yellow shaded regions indicate the D-AP5-sensitive component that could be accounted for by purely multiplicative or additive scaling operations, respectively) (Figure S6 illustrates how these scaling factors were determined). D-AP5 did not affect the responses of ON transient ganglion cells (see Figure S5), which was used as an indicator of the stability of contrast sensitivity of the retina for the duration of the experiment. Data are represented as mean ± SEM.
G. A heat map indicating the relative suppression of responses by D-AP5 across contrasts and direction (scale bar represents % suppression; (Control-AP5)/Control*100).
H. Cross-sections of the heat maps along the direction (grey; 1c from G) and contrast axes (black; 1c from G). The fraction of the response blocked by D-AP5 did not systematically change with direction, but varied strongly with contrast. Data are represented as mean ± SEM.

