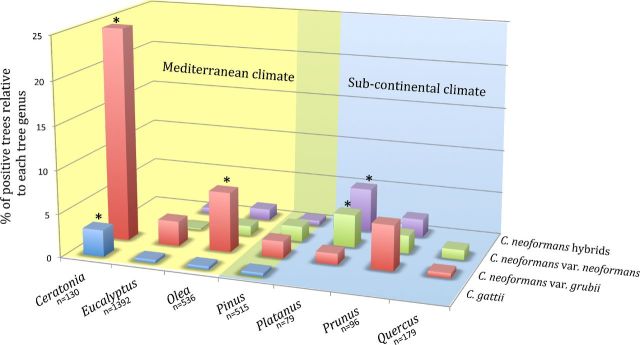
Figure 2.
Percentage of colonized trees per tree genera. In the histogram, only the tree genera that are represented at least by 2% of the total sampled trees (n = 1765) have been included. The trees of genus Pinus can adapt to different climate and in the graphic are located in an overlapping zone. Asterisk indicates that the value is statistically higher (P < 0.05) compared to the values observed in the other tree populations. n = Number of sampled trees for each tree genus.

