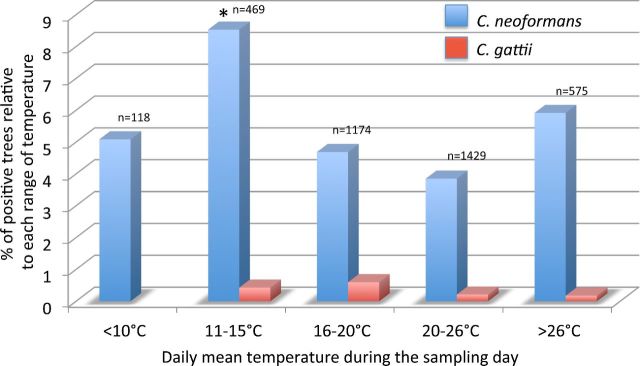
Figure 6.
Percentage of trees colonized by C. neoformans and C. gattii in relation to the daily average temperature during the sampling days. Asterisk indicates that the value is statistically higher (P < 0.05) compared to the values observed in the other groups. n = Number of sampled trees for each range of temperatures.

