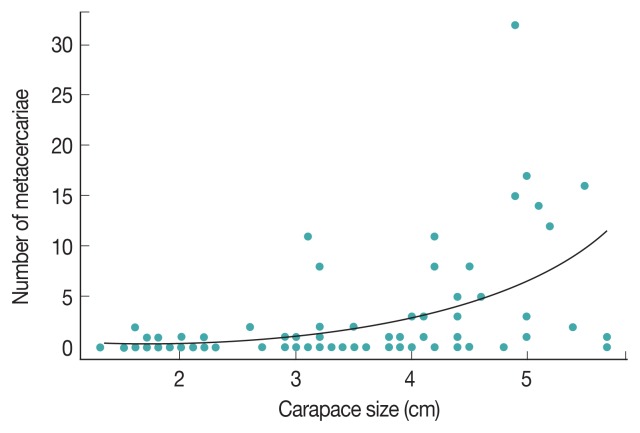
Fig. 4.
Relationship between carapace size and number of metacercariae. We found a significant positive relationship between the number of metacercariae (blue dots) and carapace size (P<0.001; intercept=-2.42, standard error=0.34; slope=0.86, standard error=0.074). The black curve represents the expected number of metacercariae (based on crab carapace size) under the Poisson regression model.

