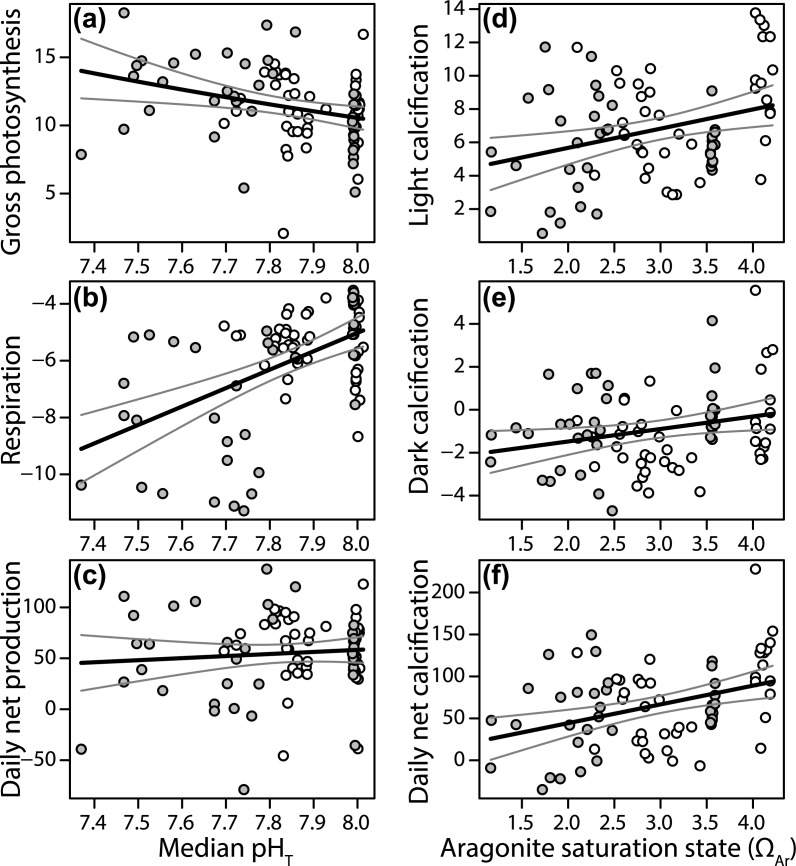
Fig 5. Metabolic rates from benthic communities on settlement tiles across the seawater carbon chemistry gradients.
Rates of gross photosynthesis (a), respiration (b) and net daily production (c) in 13 month old communities are plotted against the median pHT from the tiles. Gross photosynthesis and respiration are displayed in μg O2 cm-2 hr-1, and daily net production in μg O2 cm-2 day-1. Rates of light (d), dark (e) and net daily calcification (f) are plotted against tile median aragonite saturation state (ΩAr) from the tiles. Light and dark calcification rates are displayed in μg CaCO3 cm-2 hr-1, and daily net calcification in μg CaCO3 cm-2 day-1. White points are from Upa-Upasina and grey are from Dobu. The black lines represent the modelled mean, while the grey lines are confidence intervals.

