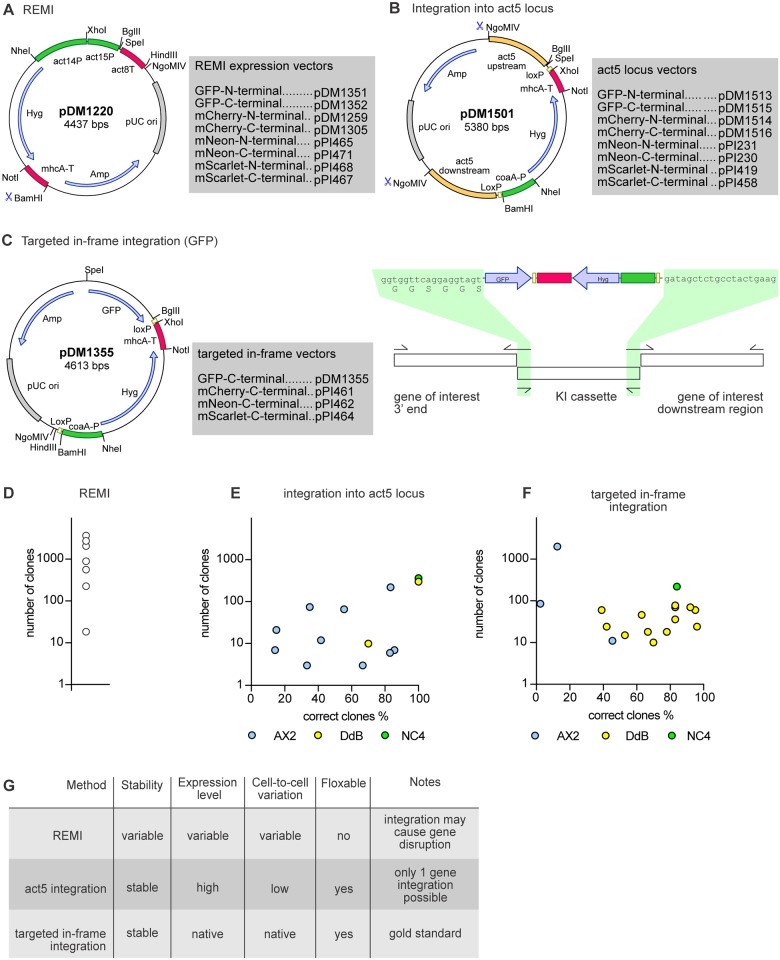
Fig 3. Stable expression using integrating plasmids.
(A) Schematic map of the REMI expression vector and table of versions for N-terminal and C-terminal tagging. In all plasmid maps the promoters are highlighted in green, terminators in pink, open reading frames in blue and origins of replication in grey. (B) Map of the act5 integration plasmid including a table of all different versions available for the creation of fluorescent fusion proteins. The recombination arms used for the integration at the act5 locus are highlighted in orange. (C) Map and schematic overview of the plasmid for targeted in-frame integration to produce C-terminal knock-ins. The crossover sequences used for the knock-in construct assembly are highlighted in green. (D-F) Efficiency of transfection using the three different strategies for making stable cell lines. Cells were transfected with 1–2 μg DNA using the optimised method outlined in Fig 2. For the act5 and targeted in-frame integrations the percentage of positive clones is given on the x-axis. The different strains used for the transfection are separately shown indicated by different colouring (AX2 in blue, DdB in yellow and NC4 in green). See Tables 1 and 2 for details of the genes. White circles shown for the REMI efficiency are for NC4. Best results came with 2 μg of BamHI-digested DNA, 5 units of DpnII and a vector with the coaA promoter replaced by the act14 promoter. (G) Table summing up the advantages and disadvantages of the three different integration methods.

