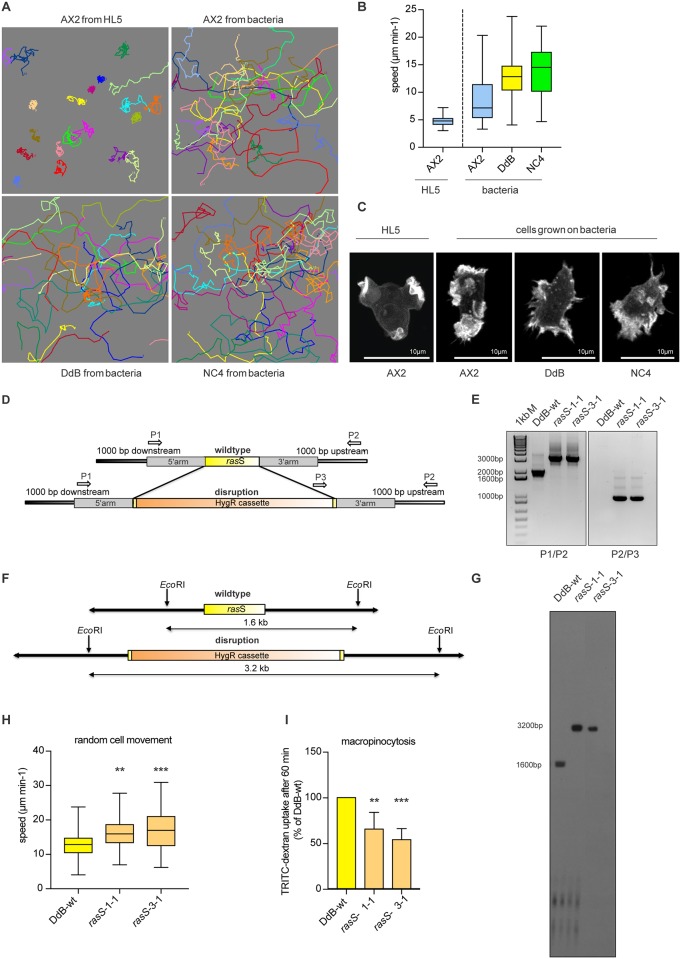
Fig 5. The relationship between axenic growth, cell motility and macropinocytosis and the role of RasS in vegetative cells.
(A) Cell tracks of randomly moving vegetative cells. AX2 cells were grown in HL5 or bacterial suspension. DdB and NC4 cells were cultured in bacterial suspension. Pictures show the tracks of 20 individual cells for each strain. The cells were filmed for 30 minutes at 2 frames per minute. (B) The effect of axenic mutations and axenic growth on cell motility. AX2 cells grown in HL5 move more slowly than AX2 grown on bacteria, which in turn are slower than wild type DdB or NC4 cells. Movies were taken at 2 frames/minute, with 3 movies per strain and 20 cells analysed from each movie. Whiskers show maximal and minimal values, with the median shown as a solid black line inside each box, where the top and the bottom represent the first and third quartiles. (C) The actin cytoskeleton of vegetative AX2, DdB and NC4 cells. Macropinosomes are the dominant feature of AX2 cells grown in HL5, whereas pseudopods dominate DdB and NC4 cells grown on bacteria; AX2 cells grown on bacteria are intermediate between these extremes. Cells expressing LifeAct-GFP as a reporter for F-actin were cultured in HL5 or bacterial suspension and examined by confocal microscopy. Scale bar 10 μm. (D) Cloning strategy used for the knock-out of rasS. The gene is shown in yellow and the disruption cassette coding for the hygromycin resistance gene in orange. The recombination arms highlighted in grey are 700 bp each and cover just about 30 bp of the coding sequence of rasS gene on each side. Primer sites are indicated with arrows. (E) Confirmation by PCR of two independent rasS- knock-out mutants (HM1920 rasS- 1–1 and HM1921 rasS- 3–1) using two different primer combinations. The band shift in first PCR (P1/P2) shows that the gene was successfully disrupted, with no wild type band detectable. The second PCR (P3/P2) confirms the correct insertion of the resistance cassette in the rasS gene. DdB wild type DNA was used as control in both reactions. The binding site of Primer 2 is located outside of the 3’ recombination arm and so is locus specific. (F-G) Verification of the disruption of the rasS genes by Southern Blotting. Cleanly disrupted recombinants are revealed by the loss of the wild type 1.6 kb band on Southern blots hybridised to a 32P labelled rasS probe. The appearance of a band of approximately 3.2 kb indicates the genomic rasS locus has been successfully disrupted by the hygromycin resistance cassette (The blot has been cropped. The unmodified original is shown in the S2 File). (H) The speed of random movement of vegetative wild type (yellow) and two rasS- mutants (orange) was measured as described in Fig 5B. The average of three experiments; maximal and the minimal values are displayed by whiskers and the median by the black line inside each box plot. Statistical analysis used an unpaired two-tailed student-t test (** p <0.005, *** p<0.0005). (G) Fluid uptake by DdB and rasS- mutant cells. The cells were incubated over night in HL5 containing 10% foetal calf serum, then the uptake of TRITC-dextran measured after 60 minutes by flow cytometry. Results are normalised to DdB. The error bars indicate the SD, n = 6; statistical analysis by an unpaired two-tailed Student-t test (* p <0.005, ** p<0.0005).

