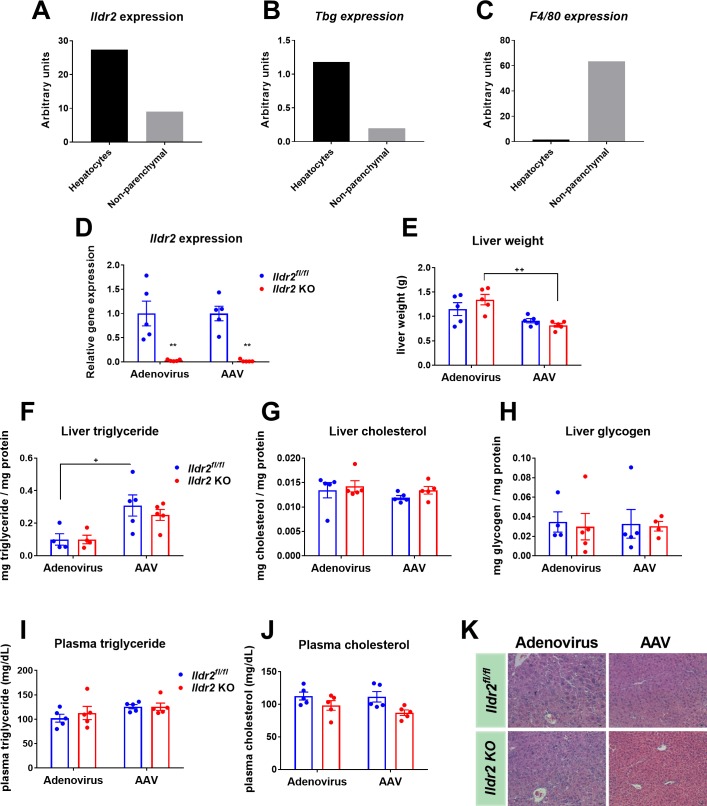
Fig 3. Adenoviral Ildr2 KO mice do not develop hepatic steatosis.
(A-C) qPCR expression of Ildr2, Tbg and F4/80 in hepatocyte or non-parenchymal cell fractions isolated from 12-week old wild-type (B6) mice. (D) qPCR expression of Ildr2 in livers of 11-week old mice, 10 days after i.v. injection with adenoviral-Cre (Ildr2Adv KO), adenoviral-GFP (Ildr2fl/fl controls), AAV-TBG-Cre (Ildr2AAV KO) or AAV-TBG-GFP (Ildr2fl/fl controls). (E) Liver weights at sac. (F-H) Liver triglyceride, total cholesterol and glycogen content. (I,J) Plasma triglyceride and total cholesterol concentration at sac following a 12hr fast. (K) Hematoxylin and eosin staining of representative liver sections at 20X magnification. n = 4–5 mice per group. * p<0.05, ** p<0.01, *** p<0.001 for Ildr2 KO vs. Ildr2fl/fl control. + p<0.05, ++ p<0.01, +++ p<0.001 for adenovirus vs. AAV.

