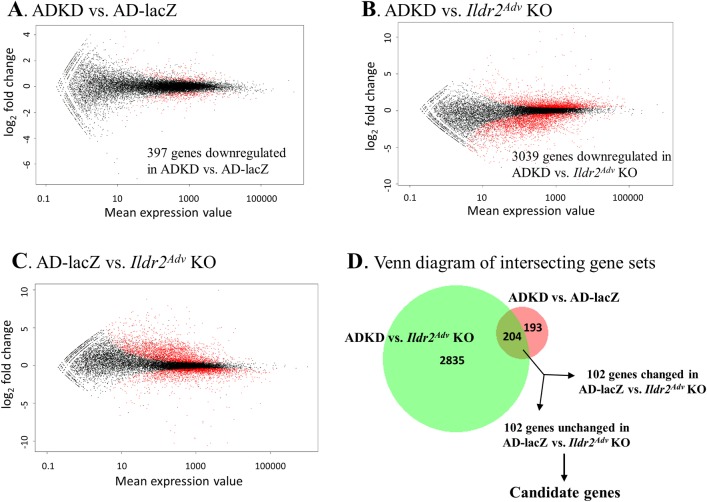
Fig 5. RNAseq analysis of AdV-KD vs. Ildr2Adv KO livers identifies candidate genes for shRNA off-target effects.
“Minus over average” (MA) plots showing log2 fold change vs. normalized mean for each comparison. Red dots represent significantly upregulated or downregulated genes in (A) ADKD vs. AD-lacZ mice, (B) ADKD and Ildr2Adv KO mice, (C) AD-lacZ vs. Ildr2Adv KO mice. (D) Venn diagram illustrating how the 102 candidate genes were identified. The intersection of genes downregulated in ADKD mice vs. both AD-lacZ and Ildr2Adv KO was 204. 102 of these genes were not significantly changed in AD-lacZ vs. Ildr2Adv KO. These became the target gene candidates (see S1 Table for complete list). This Venn diagram was created using BioVenn software [37] (www.biovenn.nl).

