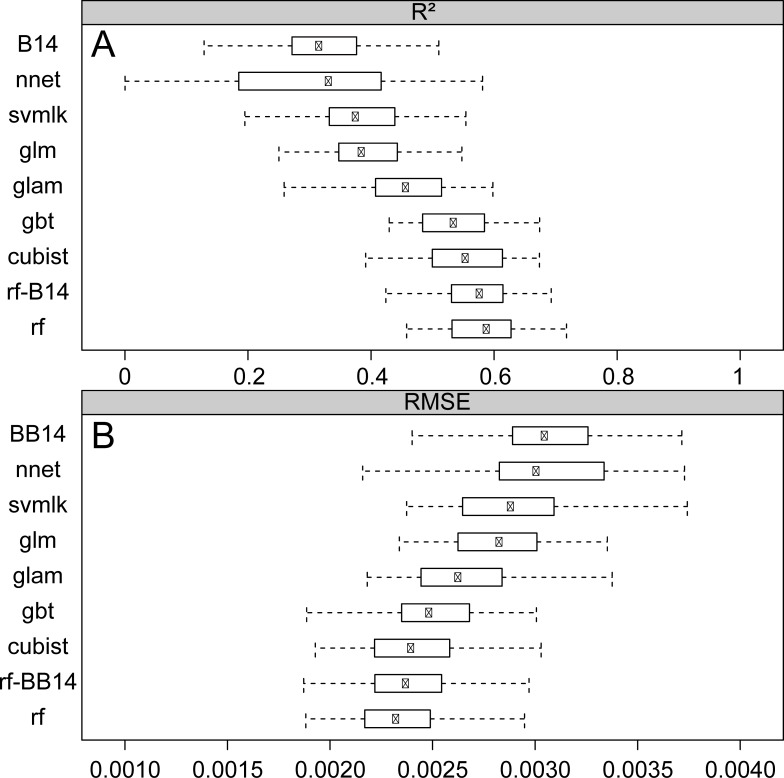
Fig 4. Model performance metrics.
Summary of tested regression algorithm performance after 10-fold cross validation with 5 repetitions using: A. boxplots of the correlation coefficient (R2) and B. boxplots of the root mean square error (RMSE). The regression methods are sorted by their predictive power from top to bottom. For model abbreviations please refer to Table 3. rf-B14: Random forest regression without Bataille et al. 2014 products; B14: Random forest regression using only Bataille et al. (2014)’s model products (Table 1).

