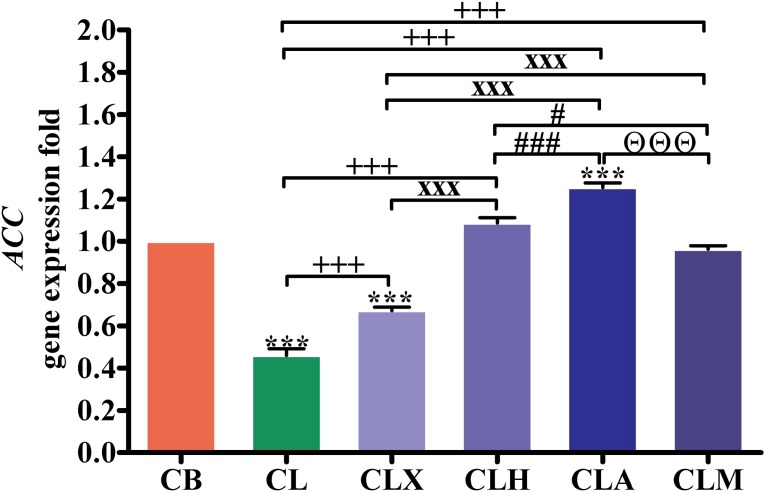
Fig 4. RT-PCR validation of the ACC gene.
Gene expression was analyzed in intestinal samples (n = 16). ***p < 0.001 vs. CB. +++p < 0.001 vs. CL. xxxp < 0.001 vs. CLX. ##p < 0.01 and ###p < 0.001 vs. CLH. ΘΘΘp < 0.001 vs. CLA. Statistical analysis was performed using one-way ANOVA and Tukey’s post hoc test for multiple comparisons. CB, control fed basal diet; CL, control fed low-energy diet; CLX, control fed low-energy diet containing Xylam 500®; CLH, control fed low-energy diet containing Hemicell®; CLA, control fed low-energy diet containing Avizyme®; CLM, control fed low-energy diet containing Megazyme®.

