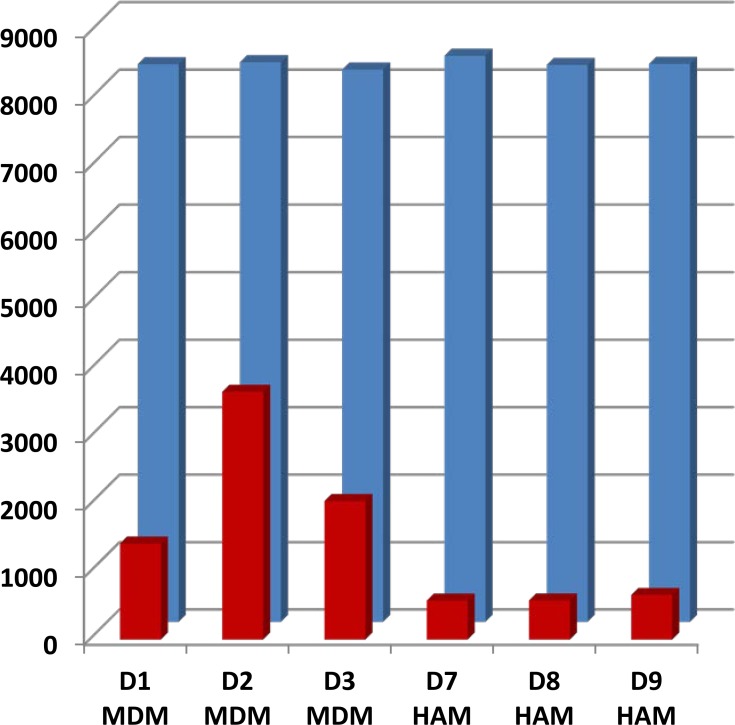
Fig 2. Comparison of transcript counts at read number >5 (RPM) and ≥1.5-fold (0.7 log2) differential expression ratio (DER) M.tb/control.
Blue bars represent the total number of transcripts detected at 5 RPM or greater in individual 24 h control samples. Red bars indicate the number of transcripts differentially expressed at 0.7 log2 (≥1.5 fold in either direction) after 24 h exposure to M.tb. Note the increased number of DE transcripts in MDM compared to HAM.

