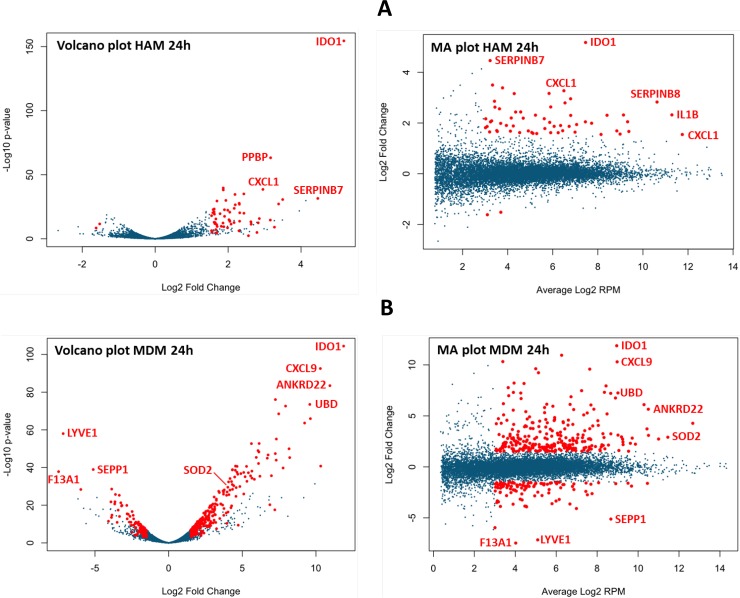
Fig 3.
(A) Volcano plot (p value versus fold change ratio M.tb/control) and MA plot (fold change ratio versus average expression in RPM) of HAM at 24 h after M.tb infection. Red dots are significant at p = ≤0.05. A few genes are identified as shown, both up- and down-regulated. (B) The same plots for MDM at 24 h. Note the substantially greater response to M.tb compared to HAM. The number of unique DE genes is greater in MDM than HAM at all 3 time points. Fig 3A and 3B were generated from an interactive web site designed to display Volcano and MA plots of the HAM and MDM AmpliSeq data at all 3 time points; producing results tables with selectable expression, FDR and p-values. The site is accessible at https://dataportal.bmi.osumc.edu/macrophagedb/.

