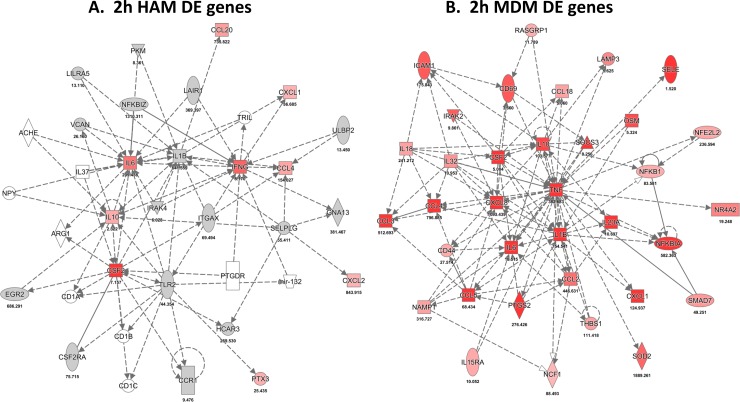
Fig 4.
Top scoring network of DE genes (IPA results) after 2 h upon M.tb infection in HAM (A) and MDM (B). Red indicates mRNA up-regulation and green down-regulation. Intensity of color is proportional to log2 differential expression ratio (DER) of average paired infected/control RNA expression. DE ratios used are the mean of three HAM and three MDM donor samples.

