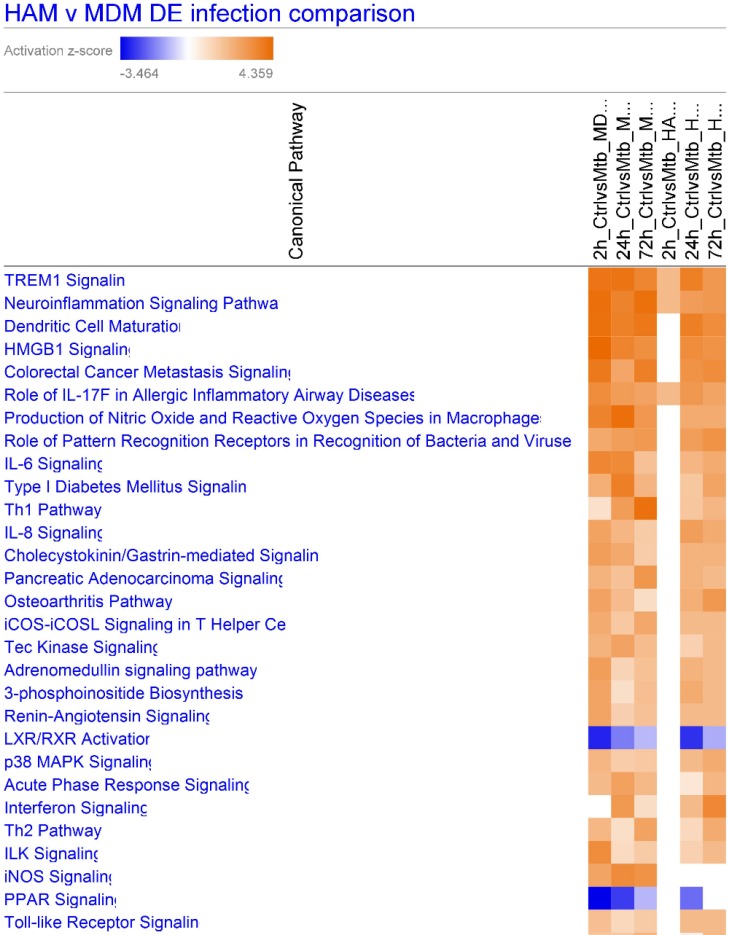
Fig 5. IPA heat map of canonical pathway activation in HAM and MDM upon M.tb infection at 2, 24 and 72 h, derived from DE genes with adjusted p≤0.05.
Colors represent activation z scores. TREM1 signaling is the top pathway in both MDM and HAM. Columns left to right are: 2, 24, 72 h MDM, 2, 24, 72 h MDM infected.

