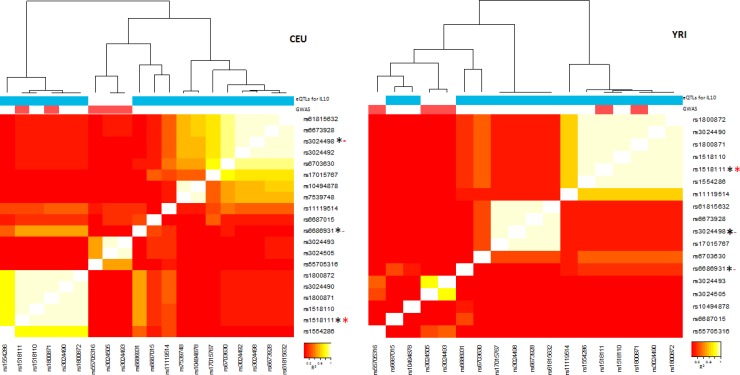
Fig 7. Linkage disequilibrium or LD heatmap of SNPs around the IL-10 gene locus that are either recognized as eQTLs in GTEx or as GWAS hits in dbGaP (for any phenotype), or both.
LD maps are constructed from Caucasian (CEU) and Yoruban (YRI) genomic SNP data, showing different haplotype configurations. The colored bars on top mark SNPs with eQTLs for IL-10 mRNA (blue), and dbGaP hits (red). The three marker SNPs highlighted (rs1518111, rs6686931, rs3024498) are marked by a * if recognized as an eQTL (black) or a dbGaP hit (red). Only rs1518111has both associations along with other variants in its LD block (white squares), while rs6686931and rs3024498 are only eQTLs. rs6686931 is in partial LD with rs1518111 in CEUs but in lower LD in Yorubans (YRIs). GWAS variants are part of two separate blocks—one separate from all eQTLs and one part of the LD block marked by rs1518111.

