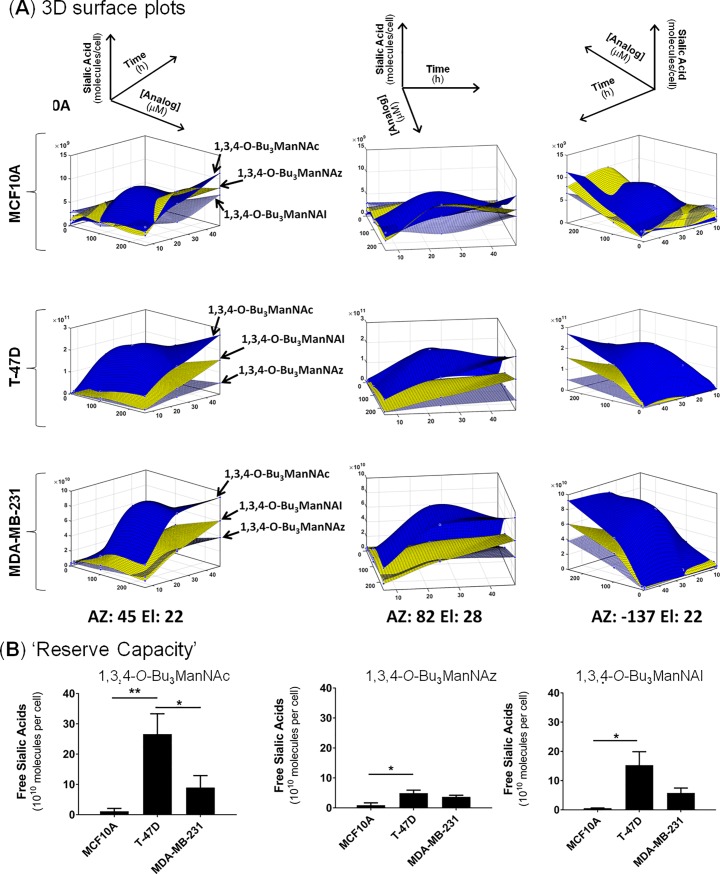
Fig 4. Metabolic profiles of Compartment 1 in analog-supplemented cells.
(A) 3D surface plots were generated for each cell line in response to treatments with analogs; sialic acid production is shown as a function of both dose and time (AZ stands for azimuth values, El stands for elevation values, and the three plots provided for each data set are rotated to depict different vantage points). (B) The Reserve Capacity for each cell line was calculated based on the highest observed increase in Compartment 1 sialic acid levels in analog-supplemented cells compared to untreated controls.

