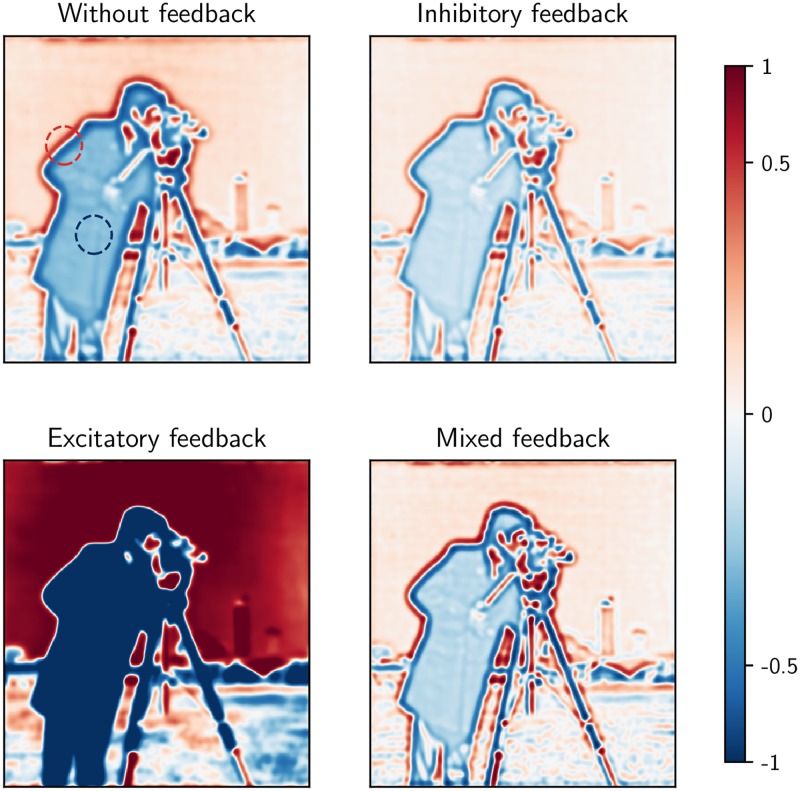
Fig 9. Mixed feedback has different effect on low and high frequency components of natural scenes in contrast to pure excitatory or inhibitory feedback.
Each subfigure shows activation of a layer of relay cells in response to the input image, shown as a logarithmic color map from blue to red (from reduced to increased response). the responses are normalized with respect to the maximum response in the case without cortical feedback. The red and blue circles mark representative parts of the image with high and low spatial frequency, respectively. Default values from Table 1 have been used except for the feedback weights which have been set at 1.8 times the listed default values to more clearly demonstrate qualitative effects.

