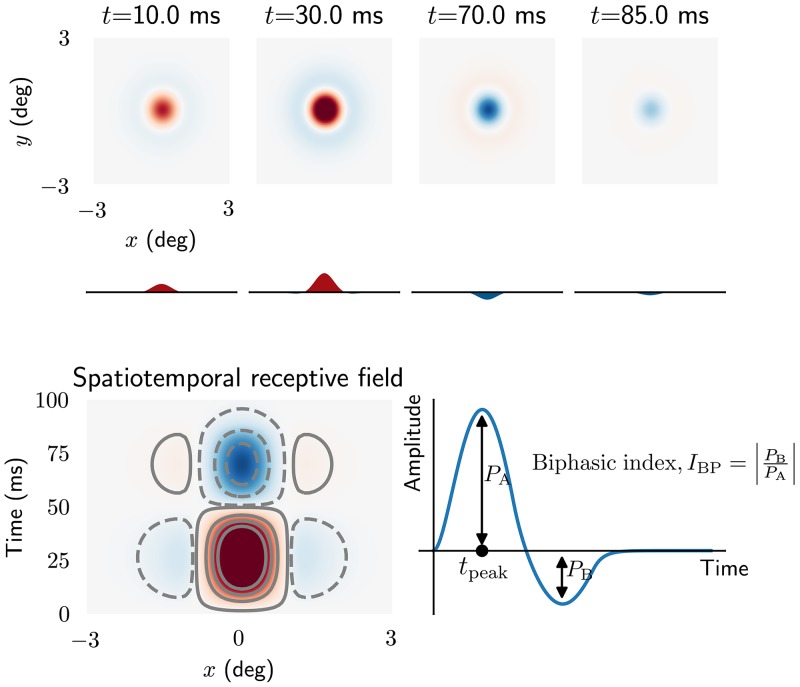
Fig 10. Spatiotemporal impulse-response function of relay cell.
Top: panels showing spatial receptive field at different times. Curves below panels are one-dimensional plots of the receptive fields as a function of x alone. Bottom left: x-t plot of receptive field. ON regions are shown in red (solid lines) while OFF regions are shown in blue (dashed lines). Bottom right: curve showing temporal evolution of ON region of the receptive field. The biphasic index IBP is defined as the ratio between the peak magnitude of the (negative) rebound phase and the peak magnitude of the first (positive) phase. tpeak is the peak response latency. Note that only feedforward excitation from retinal ganglion cells to relay cells is included.

