
FIGURE 8.
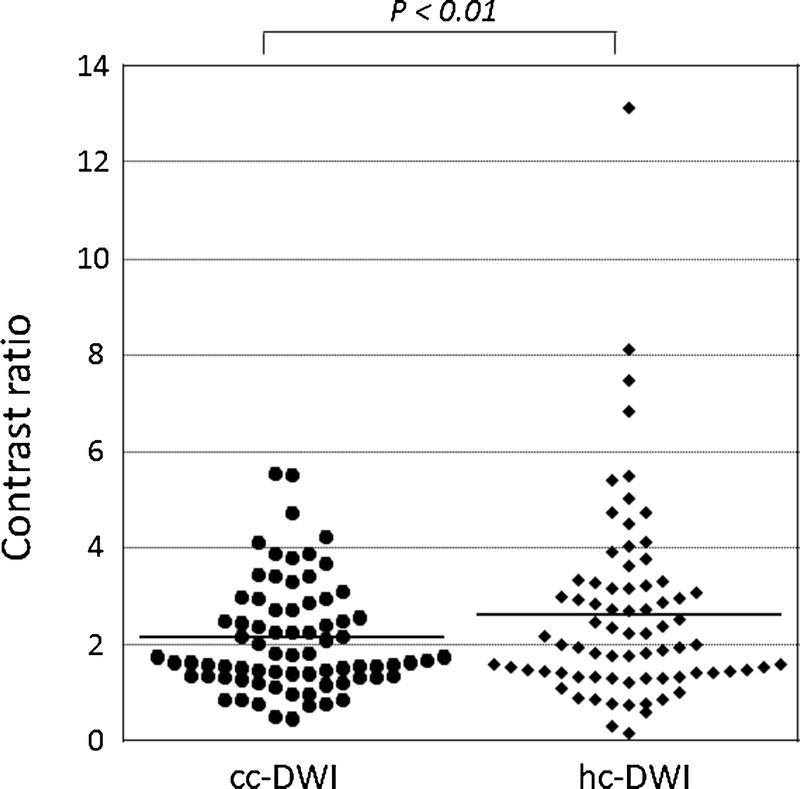
CR of HCCs on cc-DWI and hc-DWI. The solid line indicates the mean CR value in each group. It is higher on hc- than on cc-DWI (P < 0.01).
Official websites use .gov
A
.gov website belongs to an official
government organization in the United States.
Secure .gov websites use HTTPS
A lock (
) or https:// means you've safely
connected to the .gov website. Share sensitive
information only on official, secure websites.
CR of HCCs on cc-DWI and hc-DWI. The solid line indicates the mean CR value in each group. It is higher on hc- than on cc-DWI (P < 0.01).