FIGURE 9.

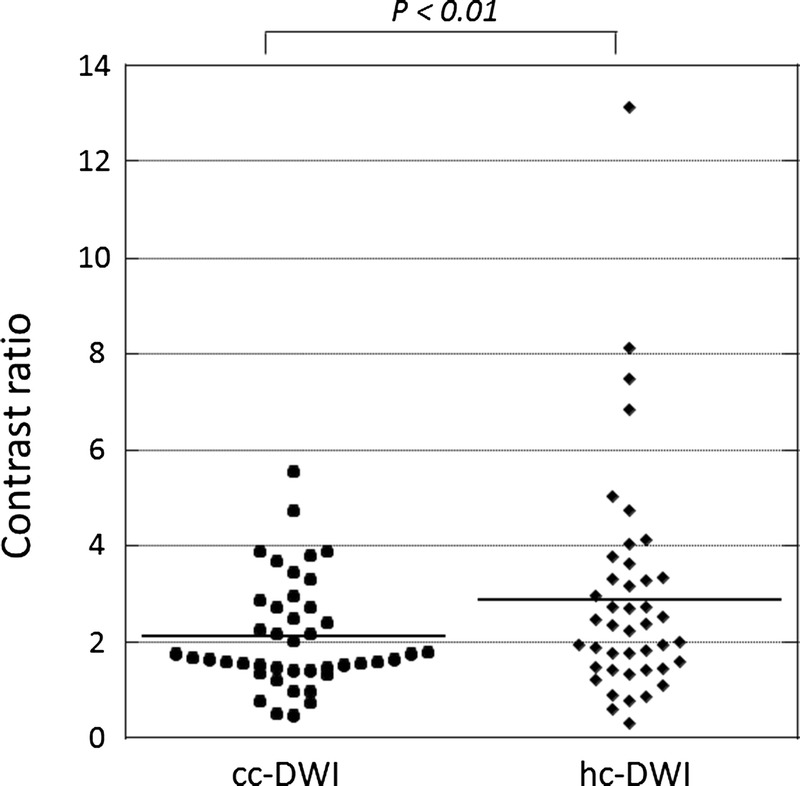
CR of HCCs smaller than 20 mm on cc-DWI and hc-DWI. The solid line indicates the mean CR value in each group. It is significantly higher on hc- than cc-DWI (P < 0.01).

CR of HCCs smaller than 20 mm on cc-DWI and hc-DWI. The solid line indicates the mean CR value in each group. It is significantly higher on hc- than cc-DWI (P < 0.01).