
Figure 1.
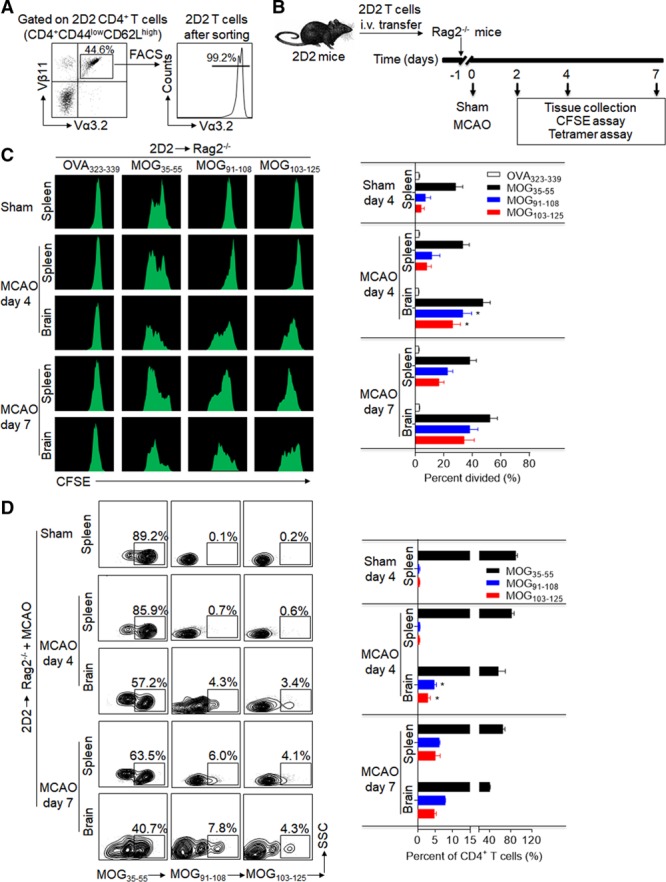
Development and expansion of 2D2 T-cell reactivity against neuroantigen epitopes within the ischemic brain. 2D2 CD4+ T cells (CD4+CD44lowCD62LhighVα3.2+Vβ11+) were sorted from naive 2D2 mice without any sign of central nervous system autoimmune disease and transferred intravenous (i.v.) into Rag2−/− mice after sham or 60-minute middle cerebral artery occlusion (MCAO) surgery. At day 4 or day 7 after surgery, 2D2 CD4+ T cells were reisolated from spleens and brains of Rag2−/− recipients. In the sham group, 2D2 CD4+ T cells were reisolated from spleens of Rag2−/− recipients at day 4 after surgery. A, Purity of sorted naive-like 2D2 T cells was validated by fluorescence-activated cell sorting (FACS). B, Schematic graph showing the experimental design. C, Flow cytometry plots and cumulative bar graph show CFSE (carboxyfluorescein succinimidyl ester) dilution (proliferation) of 2D2 CD4+ T cells in response to in vitro stimulation with OVA, MOG (myelin oligodendrocyte glycoprotein)35-55, MOG91-108, and MOG103-125 after coculture for 72 hours with antigen-presenting cells. D, After reisolation at day 4 or day 7 after surgery, 2D2 CD4+ T cells (Vα3.2+Vβ11+CD4+CD3+) were stained with PE-labeled MHC class II tetramers containing MOG35-55, MOG91-108, or MOG103-125 (to identify antigen-specific 2D2 T cells). Representative flow cytometry plots and bar graph show MOG epitope-specific T cells. All gates were set using fluorescence minus one controls. n=15 per group. Error bars represent SEM. *P<0.05, brain vs spleen.