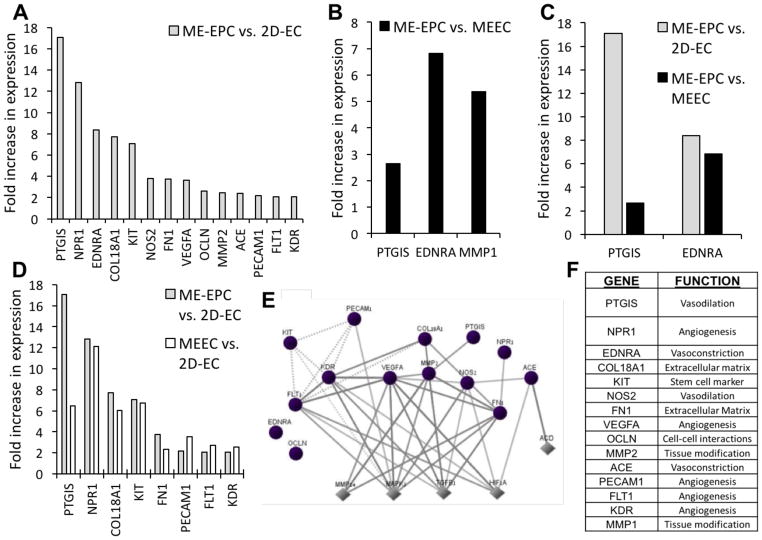
Figure 5.
Expression profile of endothelial biology genes in ME-EPCs compared to MEECs and 2D-ECs. A) While 14 genes had significantly increased expression in ME-EPCs compared to 2D-ECs, B) only 3 genes were upregulated in ME-EPCs compared to MEECs, C) with 2 of those common to both comparisons. D) Of the 14 genes differentially expressed between EPCs and 2D-ECs, 8 of these are indeed also seen when comparing MEECs and 2D-ECs. Unlike 2D-ECs, then MEECs attain a genetic fingerprint similar to ME-EPCs. E) The pathways of MAPK1, TGFB1, and HIF1A, which are central to this expression profile (Circles: genes probed; Diamonds: neighboring upstream/downstream genes). F) The genes covers a variety of functions. All genes shown were significantly upregulated (p < 0.05) by more than twofold after comparison of three samples per cell–substrate condition.

