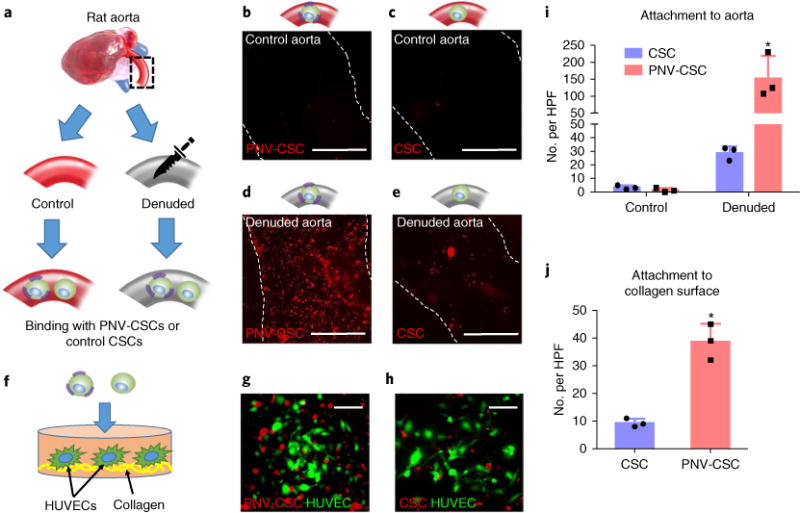
Fig. 4. PNV decoration promotes CSC binding to damaged rodent vasculatures.

a, A schematic showing the experimental design for denuded rat aorta binding. b–e, Representative fluorescent micrographs showing the adherence of DiI-labelled PNV-CSCs and CSCs on control (b,c) or denuded (d,e) aortas. Scale bars, 1 mm. f, A schematic showing PNV-CSCs (left) or CSCs (right) seeded on collagen-coated tissue culture slides. HUVECs, human umbilical vein endothelial cells. g,h, Representative fluorescent images showing the binding of DiI-labelled PNV-CSCs (g) or control CSCs (h) on HUVECs cultured on collagen surfaces. Scale bars, 50 μm. i,j, Quantitative analysis of cell binding (n = 3 experiments per group). *P< 0.05 when compared to CSC group. All values are mean ± s.d. Two-tailed t-test for comparison between the two groups. HPF, high-power field.
