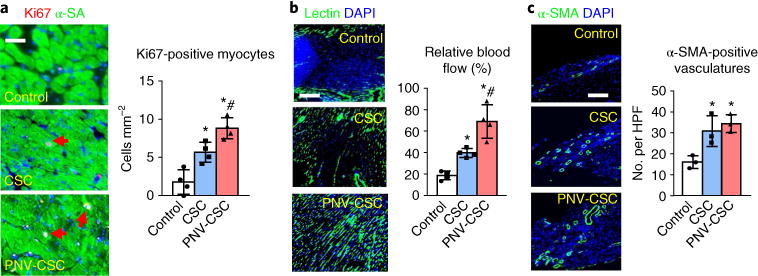
Fig. 6. PNV-CSC therapy promotes myocyte proliferation and angiogenesis.

a, Representative images showing Ki67-positive cardiomyocyte nuclei (red, with red arrows) in control PBS-, CSC- or PNV-CSC-treated hearts at 4 weeks. Right: quantitative analysis of the numbers of Ki67-positive nuclei. n = 4 animals per group. Scale bar, 20 μm. b, Representative images indicating lectin-labelled blood vessels (green) in control PBS-, CSC- or PNV-CSC-treated hearts at 4 weeks. Right: quantification analysis of the lectin fluorescent intensities. n = 4 animals per group. Scale bar, 100 μm. c, Representative micrographs showing arterioles stained with antibody against α-smooth muscle actin (α-SMA, red) in PBS-, CSC- or PNV-CSC-treated hearts at 4 weeks. HPF, high-power field. The numbers of α-SMA-positive vasculatures were compared. n = 3 animals per group. Scale bar, 50 μm. *P< 0.05 when compared to the control group; #P< 0.05 when compared to the CSC group. All data are mean ± s.d. Comparisons were performed using one-way ANOVA followed by post-hoc Bonferroni test.
