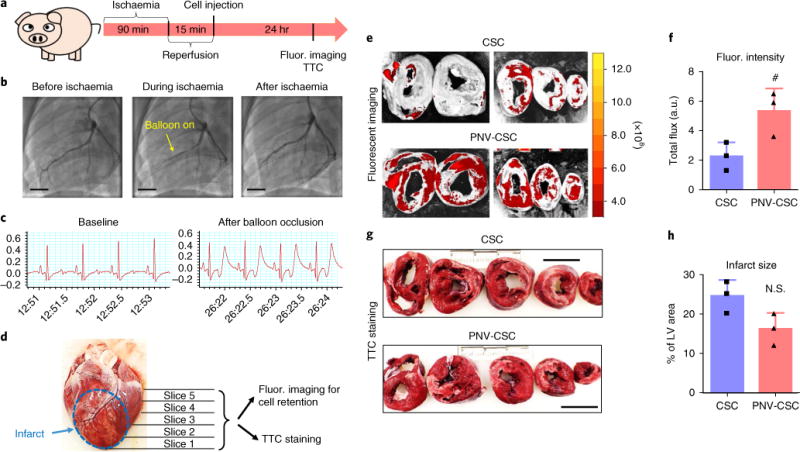
Fig. 8. PNV decoration augments CSC retention in a porcine model of ischaemia/reperfusion.

a, A schematic showing the pig study design. b, Angiograms showing coronary flow and placement of balloon before, during and after ischaemia. Scale bars, 15 mm. c, Representative electrocardiograms at baseline and after balloon occlusion. d, A representative excised pig heart image showing the preparation of myocardium slices for ex vivo fluorescent imaging and TTC staining. e, Representative ex vivo fluorescent imaging of ischaemia/reperfusion pig hearts 24 hrs after intracoronary infusion of CM-DiI-labelled CSCs or PNV-CSCs. f, Quantitation of fluorescent signals in CSC- or PNV-CSC-treated hearts (n = 3 pigs per group). g, Representative TTC staining images showing infarct region (white). Scale bars, 4 cm. h, Quantitation of infarct size (n = 3 pigs per group). #P< 0.05 when compared to the CSC group. All values are mean ± s.d. Two-tailed t-test for comparison.
