Figure 3.

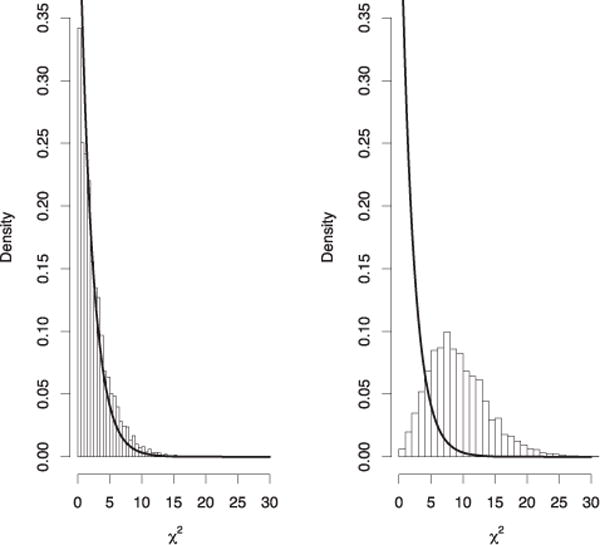
Histogram of posterior samples of Pearson’s chi-squared test for goodness of fit under the moment (left panel) and normal prior (right panel) models for the nonnull effect sizes.

Histogram of posterior samples of Pearson’s chi-squared test for goodness of fit under the moment (left panel) and normal prior (right panel) models for the nonnull effect sizes.